
Presentation Manager Web Transition
Project for: Nielsen Media Research / Commspoint
Presentation Manager was part of Commspoint’s transition from a desktop application to a web-based product. At first, the project looked like a migration challenge, but the real challenge was much deeper: understanding which workflows truly mattered, reducing product complexity, and helping the team make confident product decisions with evidence.
Instead of rebuilding the full desktop experience, we needed to identify the core user journeys, validate what users actually needed for a successful first release, and define a focused V1 that was valuable, usable, and realistic to build.
I led the UX research, discovery, prioritization, usability testing, and validation process. My work helped translate user behavior into product decisions, align stakeholders around a focused release strategy, and reduce uncertainty before development moved further.
Problem Definition
The initial expectation was to bring most of the existing desktop functionality into the web version to avoid missing anything important.
So at that point, the scope was still quite open, and there was ongoing discussion around how much of the desktop experience should actually be carried over.
And honestly, that uncertainty was one of the main reasons we started focusing heavily on research and workflow validation.
Rebuilding everything would have increased complexity for users, created a heavier interface, and slowed down development. It also would have made the first release much harder to validate because the team would be carrying too many assumptions at once.
The real challenge was not simply deciding what to design. It was deciding what mattered most.
We needed to understand which workflows users truly depended on, where friction appeared, which features were essential for the first release, and which ideas could safely move to future iterations.
So the goal became turning assumptions into testable questions and using real user evidence to guide product decisions.
My Role
I led the UX side of the project from discovery to validation.
My role was not limited to interface design. I was responsible for understanding the existing desktop workflow, shaping the research approach, identifying key assumptions, creating usability test scenarios, running user interviews, analyzing behavioral patterns, and translating findings into product decisions.
I worked closely with Product and Engineering to connect user needs, technical constraints, and release priorities.
One important challenge was balancing user needs, technical feasibility, and release constraints at the same time.
Discovery helped create a shared understanding before moving into design decisions.
My responsibilities included:
- Defining the research and validation approach.
- Analyzing the existing desktop workflow and product assumptions.
- Creating realistic task-based usability testing scenarios.
- Identifying behavioral patterns and friction points.
- Translating research findings into product scope and design decisions.
- Aligning Product, Engineering, and stakeholders around a focused V1 direction.
Discovery and Research
Before proposing solutions, I focused on understanding how users actually worked with Presentation Manager and which parts of the desktop experience were truly valuable.
I worked closely with Product and Engineering to understand business goals, technical constraints, existing assumptions, and the expected scope of the web transition.
The discovery focused on three main questions;
- Which workflows were essential for users?
- Which parts of the desktop experience created value?
- Which features were important for V1, and which could wait?
The approach included user interviews, workflow analysis, task-based usability testing, participant notes, metric tracking, behavioral observation, and findings synthesis.
This shifted the project from assumption-driven planning to evidence-based decision-making.
Before starting research, I wanted to understand not only user behavior but also where business goals, technical constraints, and assumptions created uncertainty.
The goal was not simply to collect findings. It was creating enough confidence for the team to make better product decisions.
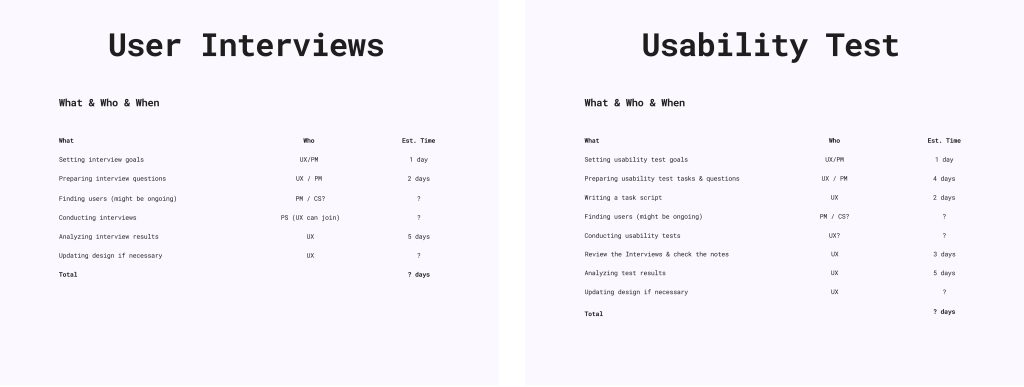
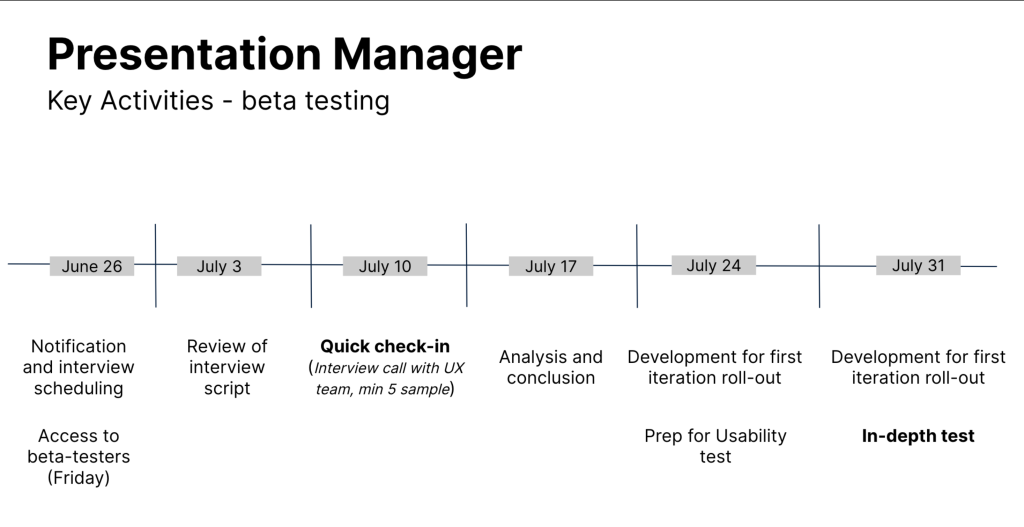
Planning
This phase focused on structuring the research approach before user sessions started.
I defined the testing flow, prepared realistic scenarios, aligned the session structure with Product and Engineering, and made sure the research would produce findings that could directly inform product scope and design decisions.
The goal was not only to test usability, but to create a clear decision-making framework for the V1 release.
Key Insights
Early discussions and workflow analysis revealed a potential risk around recreating the entire desktop experience in the web version.
There were concerns that bringing too much functionality into the first release could increase complexity, reduce development focus and make validation more difficult.
Because of this, the research focused on understanding which workflows users truly depended on, which actions needed to feel fast and intuitive, and what the core experience for the first release should look like.
These early insights helped shape the direction of interviews, usability testing, and prioritization discussions.
Research Hypotheses
Before running sessions, I created several assumptions that needed validation:
- Users may struggle finding key actions
- Users may depend heavily on visual previews rather than menus
- Desktop workflows may include unnecessary complexity
- Users may not require the complete desktop experience to complete their goals
- Less experienced users may require stronger guidance
Prioritization Strategy
Based on the research, I helped the team define a clearer V1 scope.
Instead of treating every desktop feature as equally important, we grouped features into three levels:
- Core workflows required for V1
- Supporting features for later releases
- Low-value or edge-case features
This gave Product and Engineering a clearer release strategy. It reduced unnecessary complexity, improved development focus, and helped stakeholders understand why some ideas should be built immediately while others should wait.
The prioritization work turned research findings into actionable product decisions
Success Metrics (HEART)
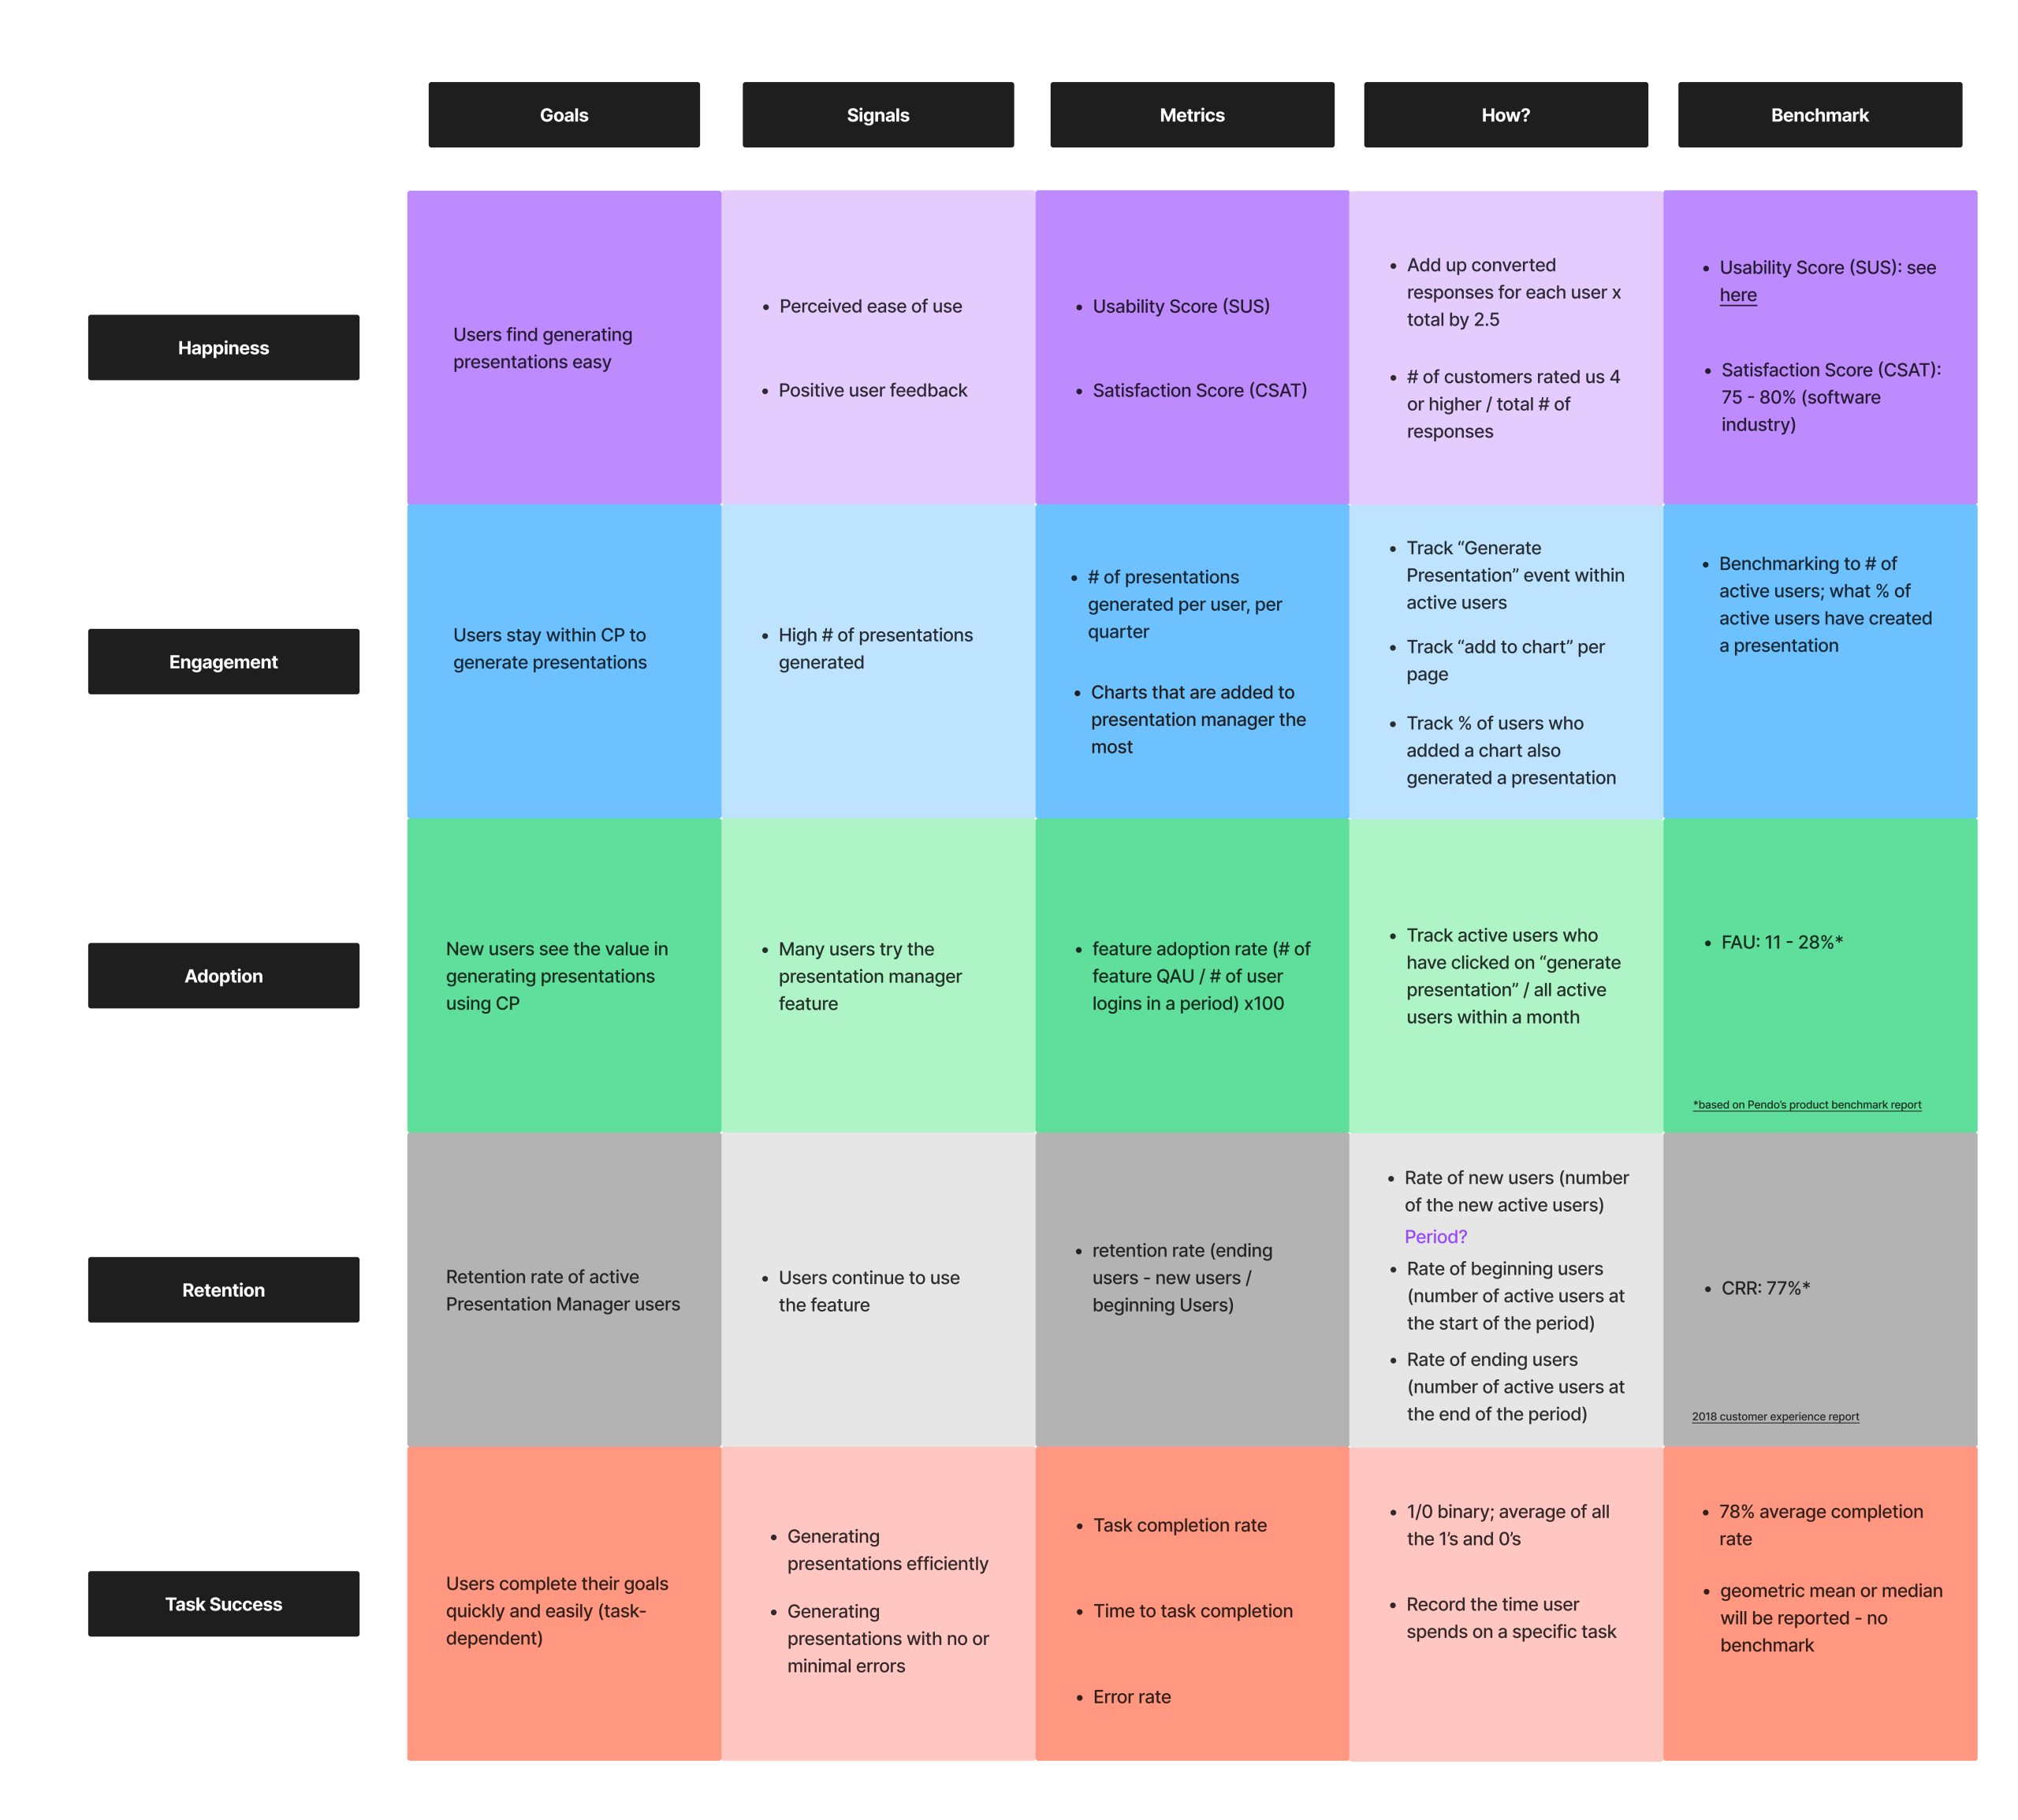
Success Metrics and Validation Using the HEART Framework
I used the HEART framework to define success before testing, so the team could evaluate the experience through clear behavioral signals instead of subjective opinions.
Happiness
Users needed to feel that the product was clear, easy to understand, and useful.
Engagement
Users needed to interact confidently with core features such as adding charts, previewing slides, managing templates, and generating presentations.
Adoption
Users needed to understand the value quickly and complete their first presentation flow without heavy guidance.
Retention
The experience needed to feel useful enough for repeated usage.
Task Success
Users needed to complete tasks with minimal confusion and clear outcomes.
These metrics helped connect research observations to product confidence. They gave the team a structured way to understand whether the focused V1 direction was usable, valuable, and ready to move forward.
Research Materials
To keep the sessions consistent, I prepared a structured interview invitation and usability testing script.
These materials ensured that all participants received the same context, tasks, and instructions.
Template e-mail for the interviewees
Email Subject Line: [Tool name] Presentation Manager Usability Test Invitation
Hello [Insert Name],
I am [insert name] from Nielsen [team name].
Thank you for being a part of our usability testing to improve our product.
Our team is kicking off this initiative to collect feedback from users to help improve the usability of a new feature, “Presentation Manager” that’s going to be launched soon.
This usability test consists of an interview, starting on July 28th, 2023 Please let us know if you would like to be part of the interview.
Interview details
– We’re going to ask you a few questions to see what you think of the feature and whether it has anything you like or dislike.
General interview guidelines
– The interview will be for approximately 60 minutes and will be remote video calls via Google Meet.
– The interview will be recorded (with your permission) for internal Nielsen reference, we can talk about what this means in detail before the session starts.
Please be aware that our aim is only to test this feature, not you or your way of using this tool.
You don’t need to prepare anything for this session unless you don’t want to, we are just looking for your thoughts and feedback.
Usability Testing Script
Introduction
Hello, first of all, thank you for taking the time to be here today. My name’s [moderator], I’m a part of the UX team for Commspoint and I’ll be walking you through today’s session. A few of my colleagues are also on the call, mainly to listen in to help take notes.
We’ve invited you here today to try out the Presentation Manager feature that will allow our clients to create a presentation using the charts inside their Commspoint web projects.
I’ll start today’s session by asking you a few questions about your role and work. Then, I will share with you a link that contains the prototype/design for the presentation manager, and I’ll ask you to go through a few scenarios using the prototype while you share your screen with us. In the meantime, we’ll also have a casual chat about what works for you and what doesn’t in the screens that you are interacting with.
Please try to go through these tasks or scenarios as if you were using them in your own work and please “Think aloud”. Tell me your thought process as you go about using them; e.g., what it is you are trying to do, what you are looking for, any decisions you are making.
If you get stuck or feel confused, I’d like to hear those too. Just remember that anything you do or say might help inform and improve the product design.
Also, please be aware that there are no wrong answers and try to be as honest as possible with your reactions and feelings. We’re having this session to improve this feature; so we are testing the feature, and not you.
If you have any questions as we go, just ask. I may not be able to answer them right away, but if you still have any questions when we’re done I’ll try to answer them then.
With your permission, I’d like to record this call. The recording will only be used to help us figure out how to improve the site, and it won’t be seen by anyone except those with a need-to-know.
Do you have any questions for me now?
*START RECORDING*
Pre-Test Questions
– Can you briefly talk about what you do in your company? What is your role and what responsibilities do you have in your role?
– What are the top three tools that you use that are essential to your workflow?
– How frequently do you use Commspoint?
– For what purposes do you use Commspoint?
– Which pages or features on Commspoint do you use the most?
Presentation Manager
– Are you familiar with the presentation manager feature?
<If yes> Have you used the Desktop version?
<If yes> When did you last use this feature?
<If yes> For what purposes did you use this feature?
<Yes and no> What file types do you typically use for your presentations?
< If requested the feature> What was the main reason you requested this feature?
Tasks & Scenarios
Great, thanks for your responses. Now we can start looking at the feature. The first thing I’d like you to do is to open the URL I am sending you just now. Next, I’ll ask you to share your screen with me. You can do that by clicking “Present now” in the bottom-right corner of our video chat. Before you share, make sure to close anything you don’t want recorded.
Now I will read some scenarios to you and I will ask you to show me what you would do in each scenario using the prototype.
A quick disclaimer: since this is only a design and not an actual production environment, not everything you see will be clickable. Importantly, the design contains elements that represent our long-term vision for the presentation manager, so some of the elements might be built in the long term.
Prompting questions to keep in mind throughout:
– What would you expect?
– What are you trying to do right now?
– What is going through your mind right now?
– How did this compare to your expectations?
– What are your thoughts on how that worked?
– That link isn’t working in the prototype. What would you expect to happen if you clicked it and it was working?
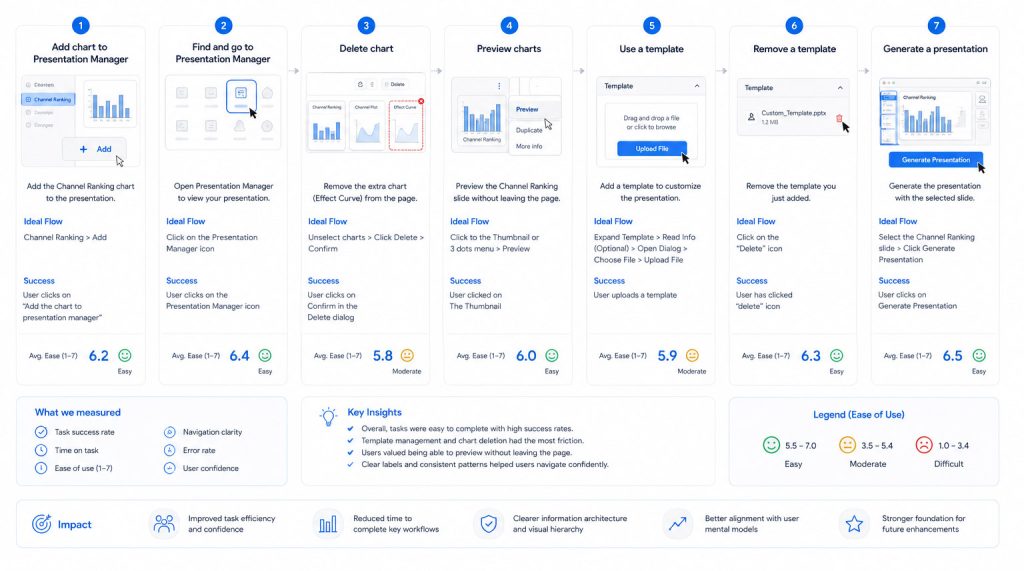
Task 1: Add chart to Presentation Manager
“You have an important meeting with a client and you want to create a presentation for this meeting. This presentation has to include the Channel Ranking chart in your Commspoint project. Show me how you would add the Channel Ranking chart to your presentation, on this page?’
Ideal Flow: Channel Ranking > Add
The task is successful when: User clicks on “Add the chart to presentation manager”
On a scale from 1 to 7 (1= very difficult, 7=very easy), how easy or difficult was this task for you?
Task 2: Find and go to the Presentation Manager page
“Now you would like to view the contents of your presentation. How/where would you do this?”
Ideal Flow: Click on the Presentation Manager icon
The task is successful when: User clicks on the Presentation Manager icon
On a scale from 1 to 7 (1= very difficult, 7=very easy), how easy or difficult was this task for you?
Task 3: Delete chart
“You realized that there is an extra chart on this page that you don’t need on your presentation, the Effect Curve chart. How would you remove this chart from this page?”
Ideal Flow: Unselect Channel Ranking + Channel Plot + Media Consumption > Click Delete > Confirm
The task is successful when: User clicks on Confirm in the Delete dialog
On a scale from 1 to 7 (1= very difficult, 7=very easy), how easy or difficult was this task for you?
Task 4: Preview charts
“Next, you want to check what the Channel Ranking slide will look like, without leaving this page. How would you do it?”
Ideal Flow: Click to the Thumbnail or Click the3 dots menu > Click Preview
The task is successful when: User clicked on The Thumbnail
On a scale from 1 to 7 (1= very difficult, 7=very easy), how easy or difficult was this task for you?
Task 5: Use a template
“Next, you want to add a template to your presentation to customize it. How would you do this?”
Ideal Flow: Expand Template area > Read Info (Optional) > Open Dialog > Choose File > Upload File
The Task is successful when: User uploads a template
On a scale from 1 to 7 (1= very difficult, 7=very easy), how easy or difficult was this task for you?
Task 6: Remove a template
“Can you also show me how you would remove the template you just added from this presentation?”
Ideal Flow: Click on the “Delete” icon
The task is successful when: User has clicked “delete” icon
On a scale from 1 to 7 (1= very difficult, 7=very easy), how easy or difficult was this task for you?
Task 7: Generate a presentation
“Lastly, you want to create your presentation with the Channel Ranking chart. How would you do this?”
Ideal Flow: Select the Channel Ranking slide (if the user doesn’t have selected one) > Click Generate Presentation
The task is successful when: User clicks on Generate Presentation
On a scale from 1 to 7 (1= very difficult, 7=very easy), how easy or difficult was this task for you?
Interview Questions
Now, please think about your overall experience of using Presentation Manager.
On a scale from 1 to 5 (1= very dissatisfied, 5=very satisfied), how satisfied are you with the presentation manager feature? Why?
– What, if anything, you liked about this feature? Why?
– What, if anything, you disliked about this feature? Why?
– Was the language clear for you? (for tooltips and explanations)
– Was the navigation as expected?
– If you could change anything in this design, what would it be? Why?
– <If the user is familiar with the feature from the desktop version> Compared to the desktop version of Presentation Manager, what do you think of this version?
Is it better, worse, or about the same? Why?
– How valuable might this feature be in your workflow?
– Anything we haven’t asked you that you think would be valuable for us to know?
Closing Remarks
Thank you for your feedback, this has been extremely insightful and helpful.
Usability Testing Setup
The usability test was built around realistic tasks from the Presentation Manager workflow.
The goal was to observe how users behaved while completing core actions, where they hesitated, what they expected, and whether the focused V1 workflow was clear enough
Participants completed tasks such as:
- Adding a chart
- Finding the Presentation Manager page
- Removing charts
- Previewing slides
- Uploading and removing templates
- Generating the final presentation
Participants were asked to think aloud during the sessions.
This helped measure clarity, confidence, hesitation points, expectation gaps, and task success.
Participants
The test included users with different levels of experience.
This was important because experienced users could compare the new web experience with their existing workflow, while newer users helped reveal where the interface needed clearer guidance.
This mix helped us understand both expert expectations and first-time usability issues.

Task notes
Task-level notes were captured during each session to understand user behavior, decision-making, friction points, and confidence levels.
I focused not only on whether users completed a task, but also on how they completed it: where they hesitated, which visual cues they relied on, what they expected to happen, and where they needed guidance.
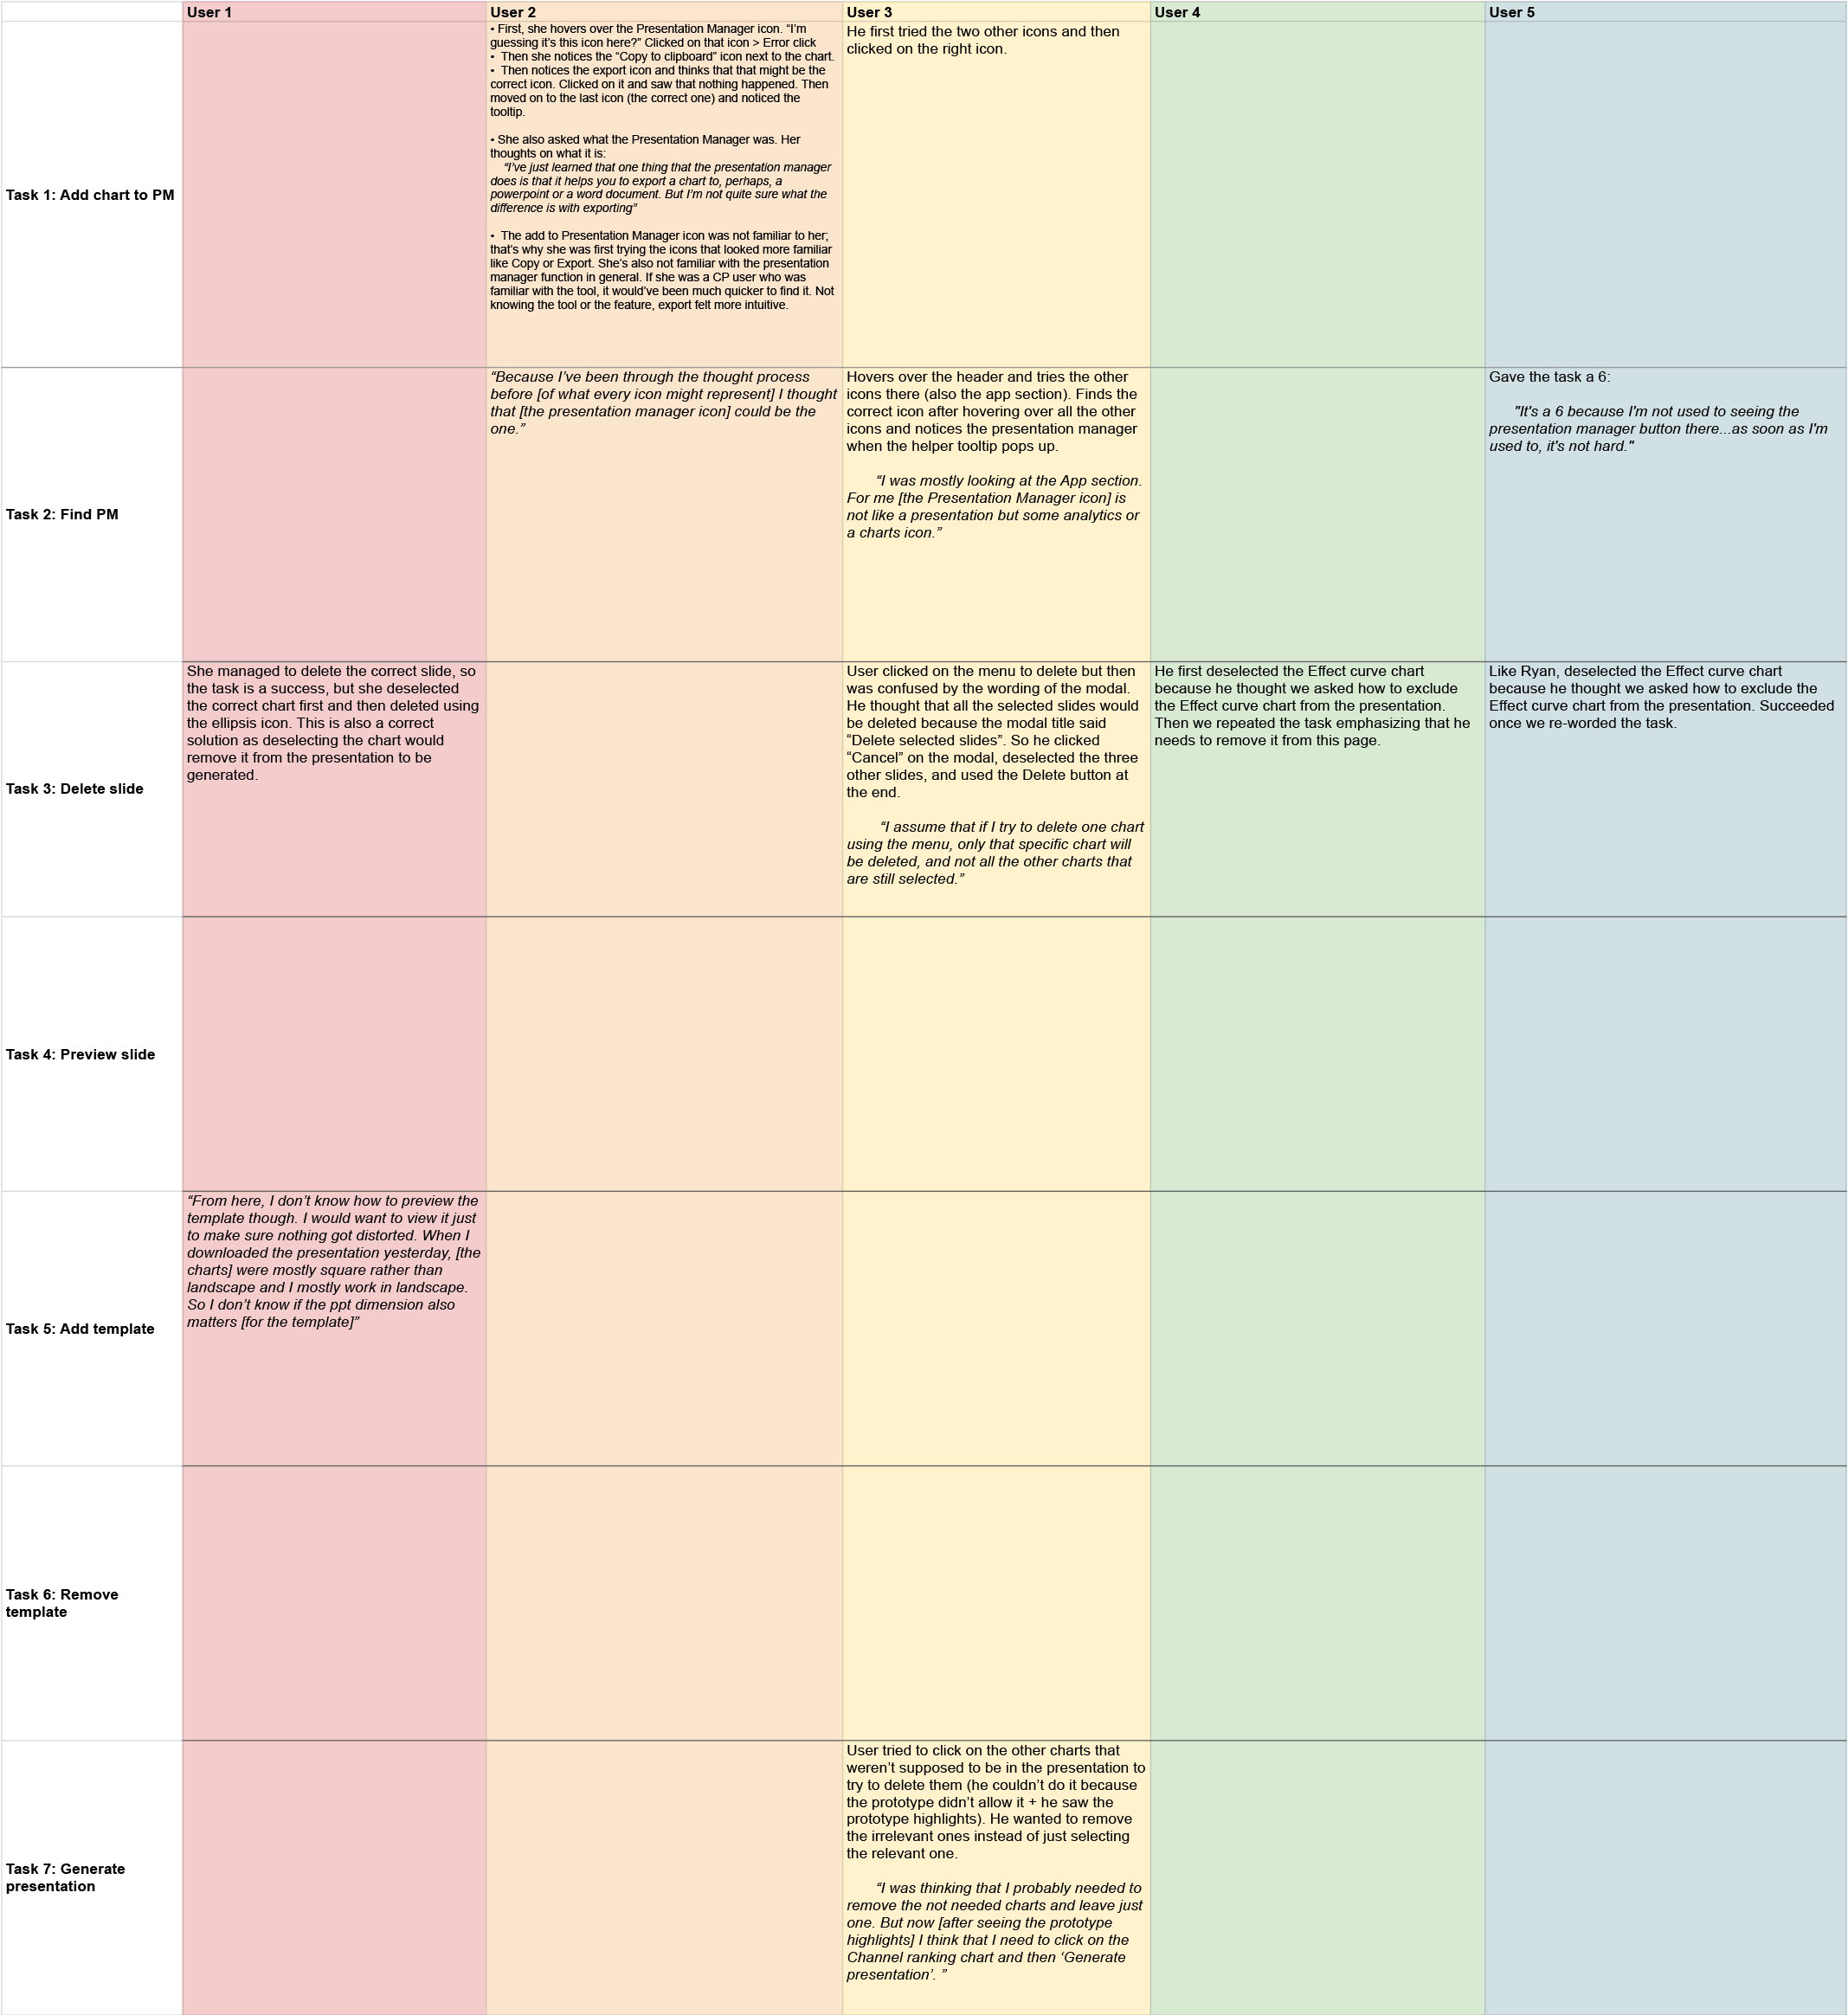
Metric Results
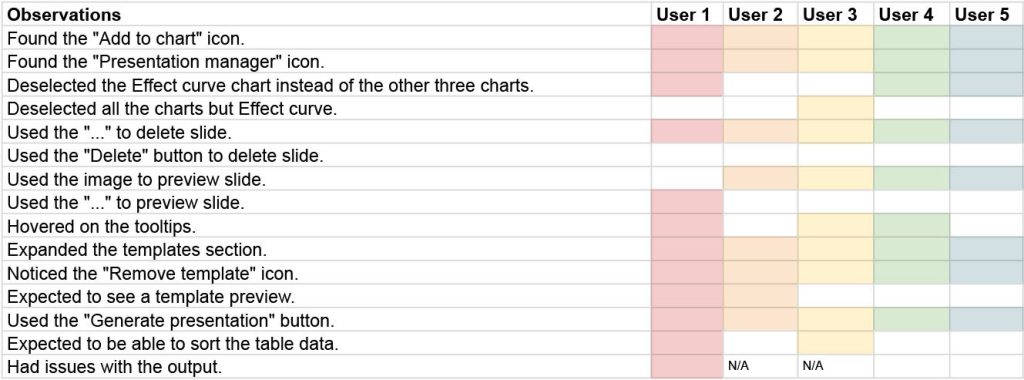
The results showed strong performance across the core V1 workflow.
All participants completed the full task flow, resulting in a 100% task success rate.
80% of users mentioned ease of use when describing their experience.
Additional patterns observed:
- 80% of participants used chart images to preview instead of menus
- 40% expected template preview after adding it
- 40% expected sorting functionality in tables
- Less experienced users needed more time to find key actions

These results validated the focused V1 direction while also revealing clear opportunities for future iterations.”
Observations
Experienced users completed tasks quickly, while newer users required more guidance.
Users relied heavily on visual cues, especially chart images, to understand what they could interact with.
Template and table interactions revealed expectation gaps that were not blocking the V1 release, but were important for future improvements.
These observations helped separate immediate usability risks from longer term enhancement opportunities.
Findings
The core workflow was usable and understandable.
All participants completed the tested tasks successfully, which confirmed that the focused V1 direction was viable.
However, the research also identified several improvement areas:
- Clearer feedback after actions
- Stronger visibility of selected content
- More intuitive preview behavior
- Better support for template preview
- Improvements for table sorting and interaction
- More guidance for less experienced users
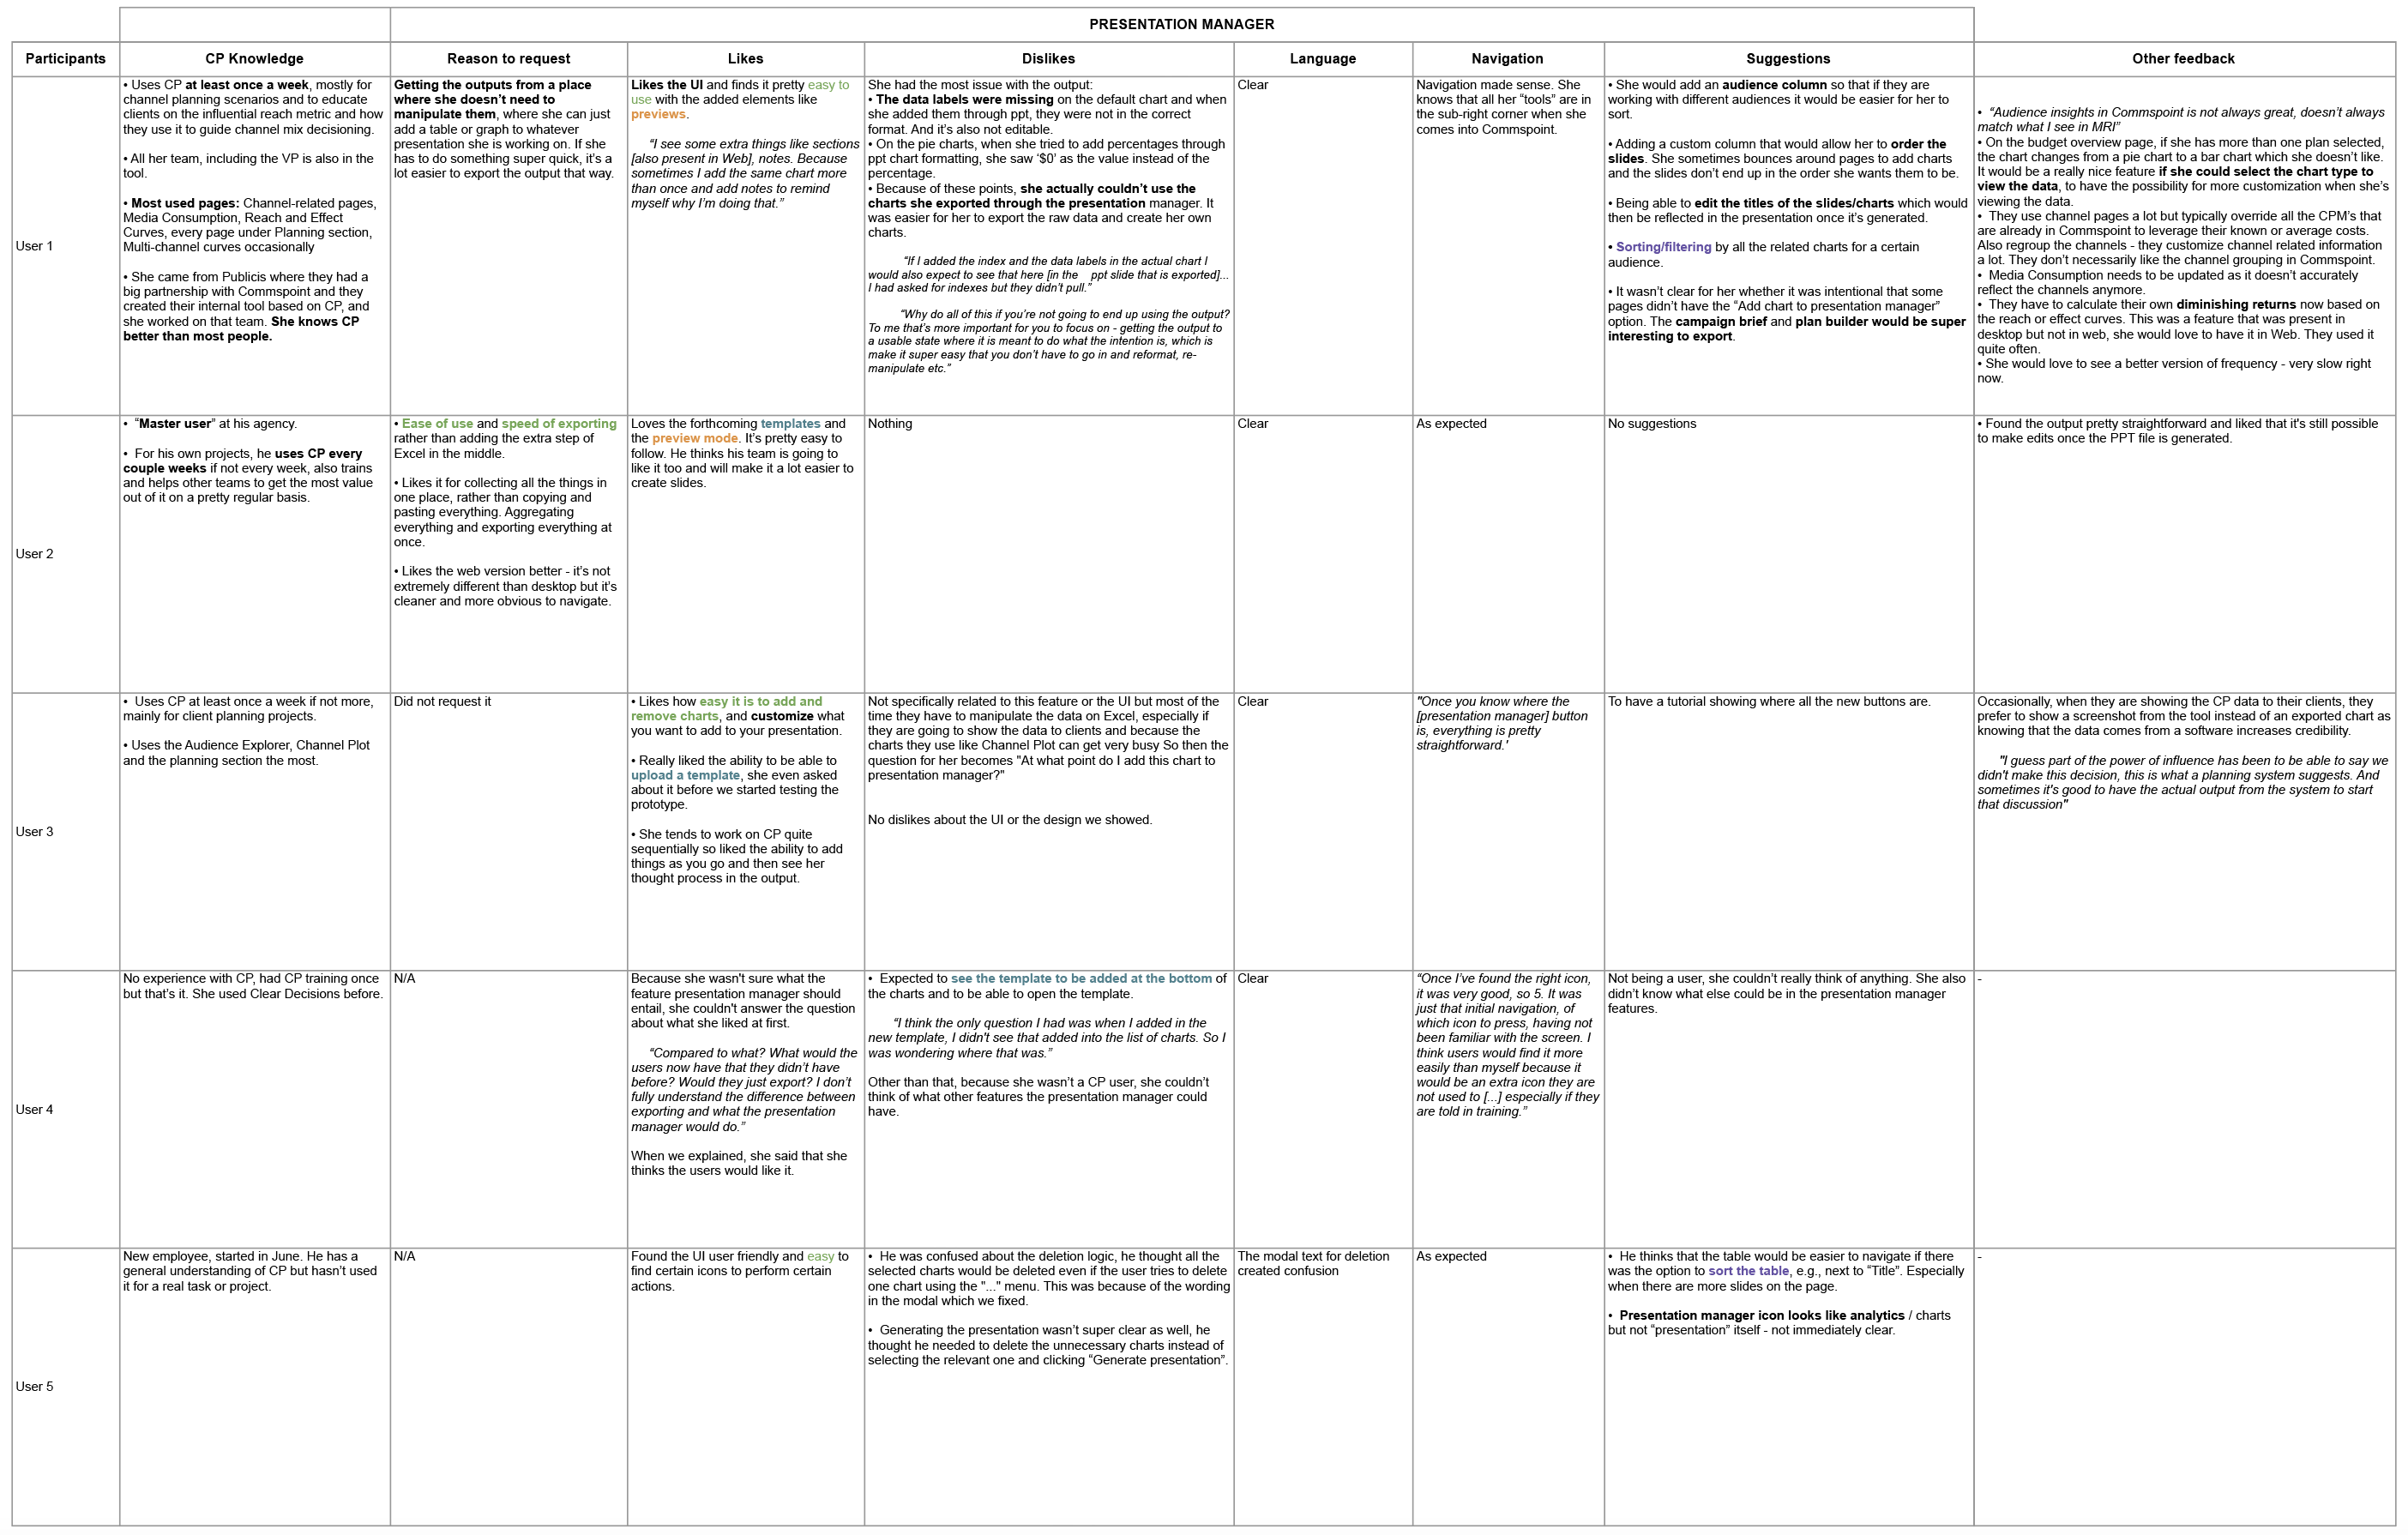
The most important finding was that users did not need a complete desktop replica. They needed a clear, focused workflow that helped them create a presentation with confidence.
Conclusion
The usability test validated the focused V1 approach.
All participants completed the core workflow successfully, confirming that the experience was functional, understandable, and valuable enough for the first web release.
The results also showed that newer users needed clearer guidance around icons and actions, and that some expectations around templates, sorting, filtering, and slide management should be addressed in future iterations.
The research helped the team move forward with confidence while keeping the product focused and realistic to build.
Outcome and Impact
The usability testing validated the core product direction and confirmed that the focused V1 approach was viable.
Key outcomes:
- Achieved 100% task success across all core workflows tested.
- 80% of users described the experience as easy to use.
- Identified key behavioral patterns, including reliance on visual previews over menu interactions.
- Revealed expectation gaps in template preview and table interactions.
- Reduced product complexity by limiting V1 to high-impact workflows.
- Helped Product and Engineering focus on what mattered most for the first release.
- Defined clear improvement areas for future releases, including sorting, filtering, slide management, template preview, and onboarding.
- Enabled product decisions based on real user behavior instead of assumptions.
The biggest outcome was not only validating usability. The project helped reduce uncertainty, create alignment across teams, and improve confidence around product decisions before development moved further.
UI Examples
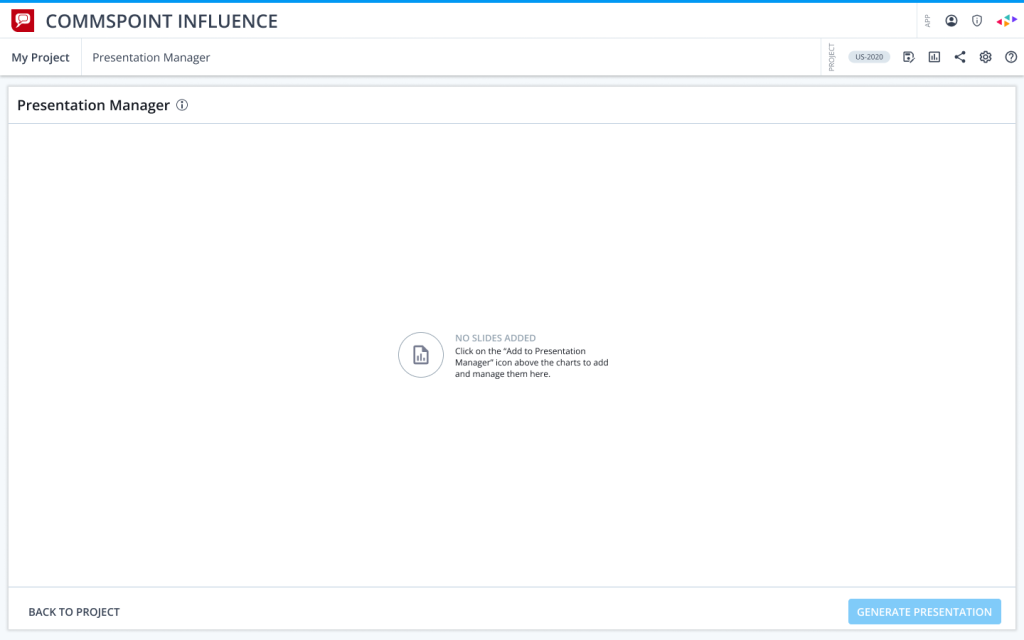
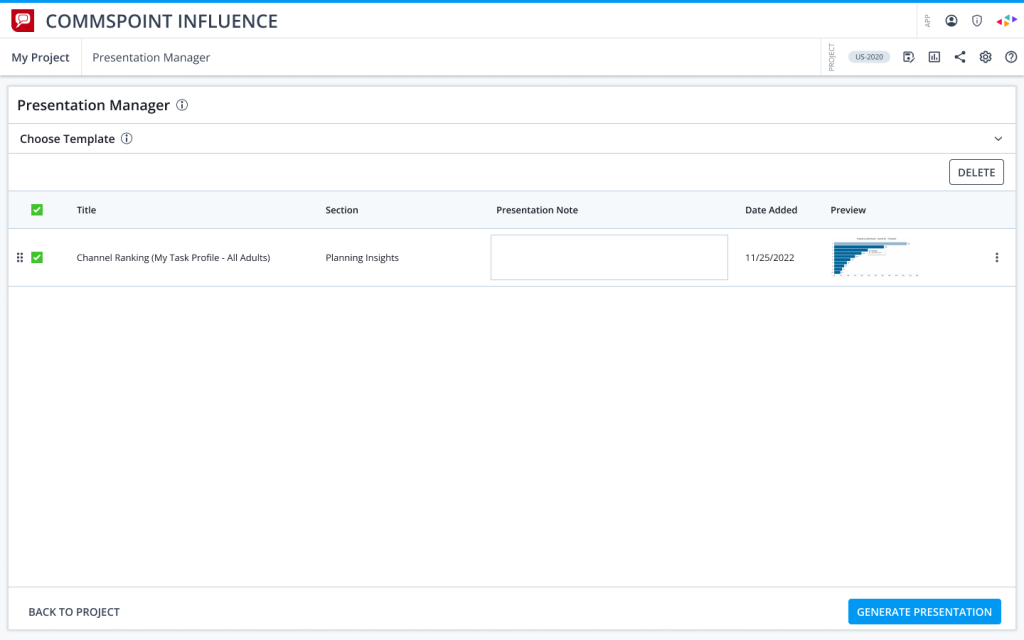
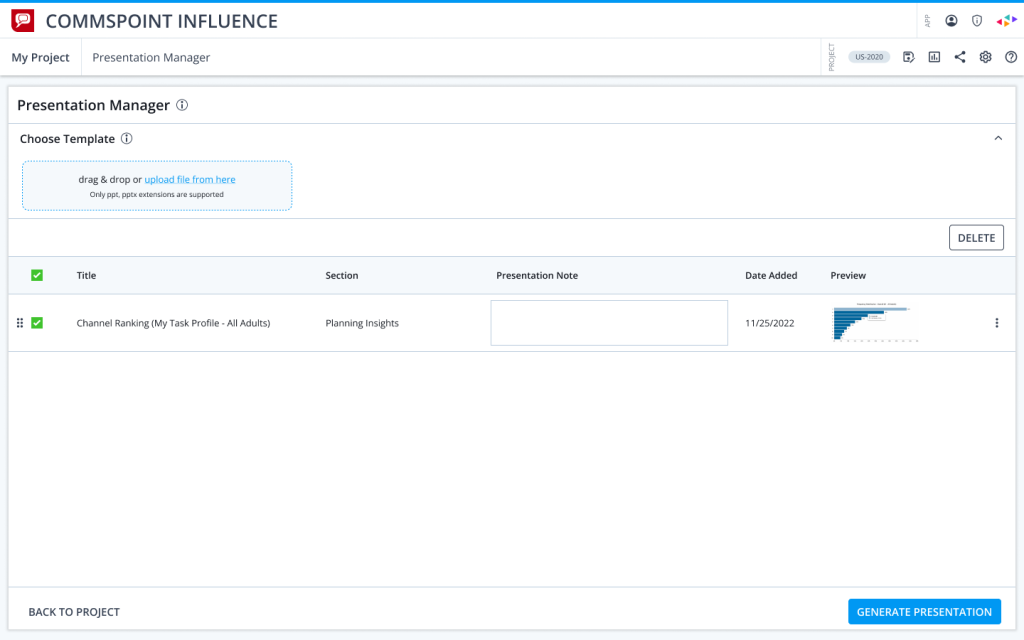
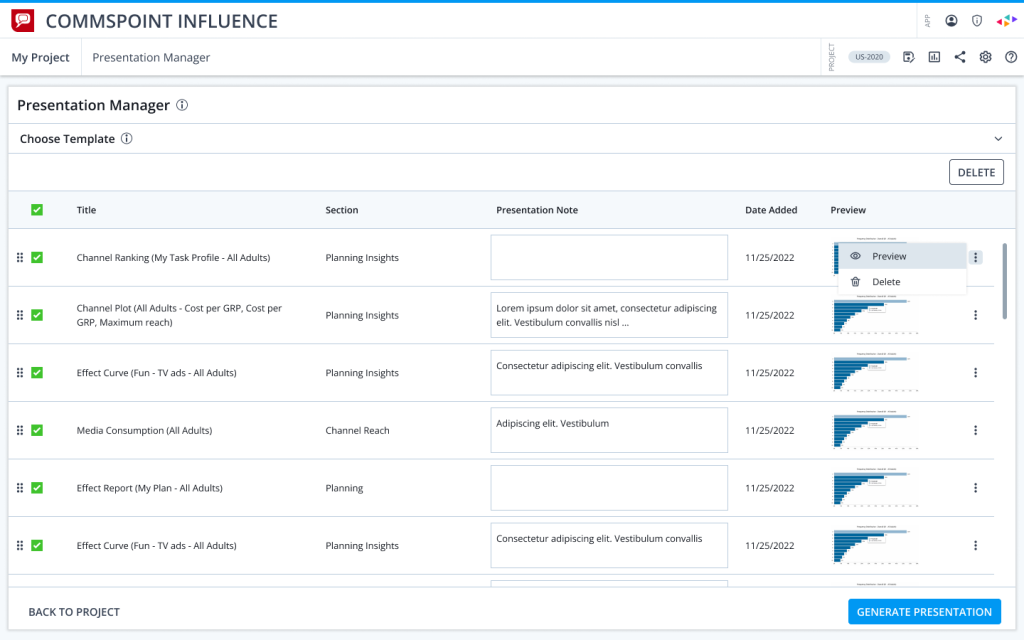
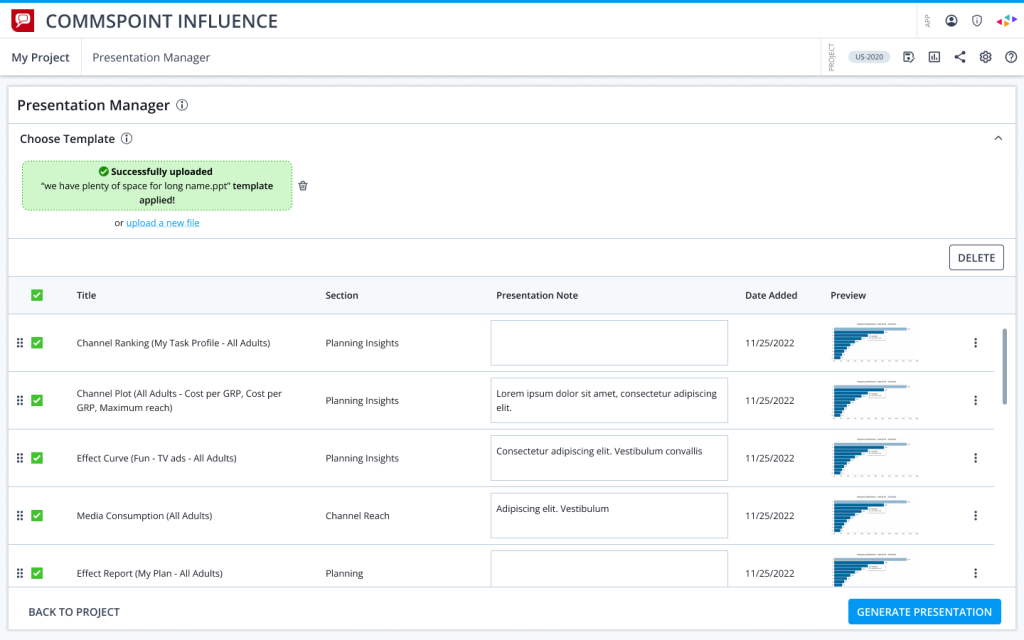
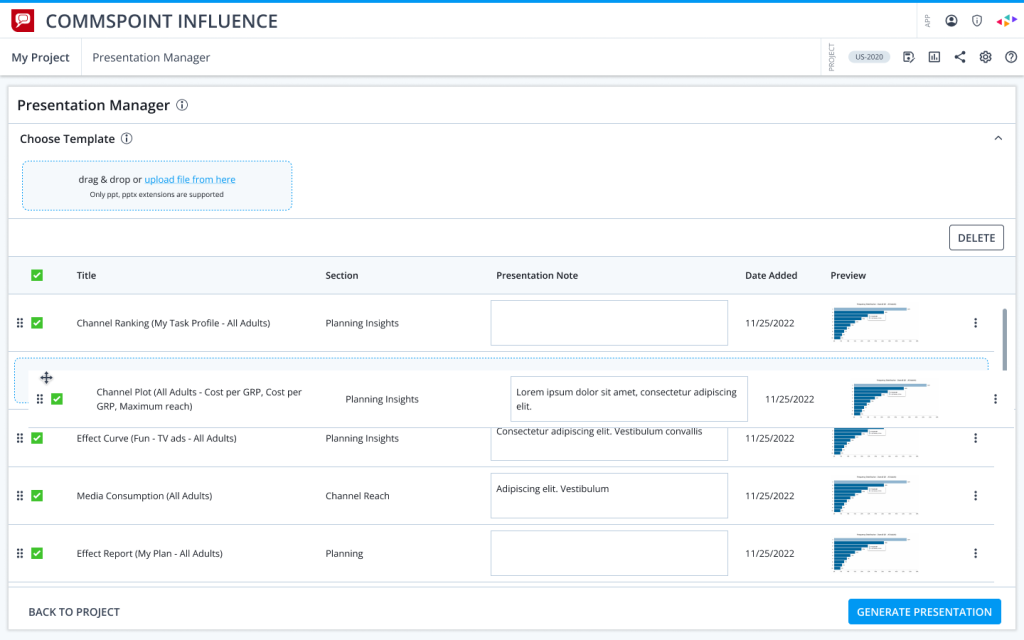
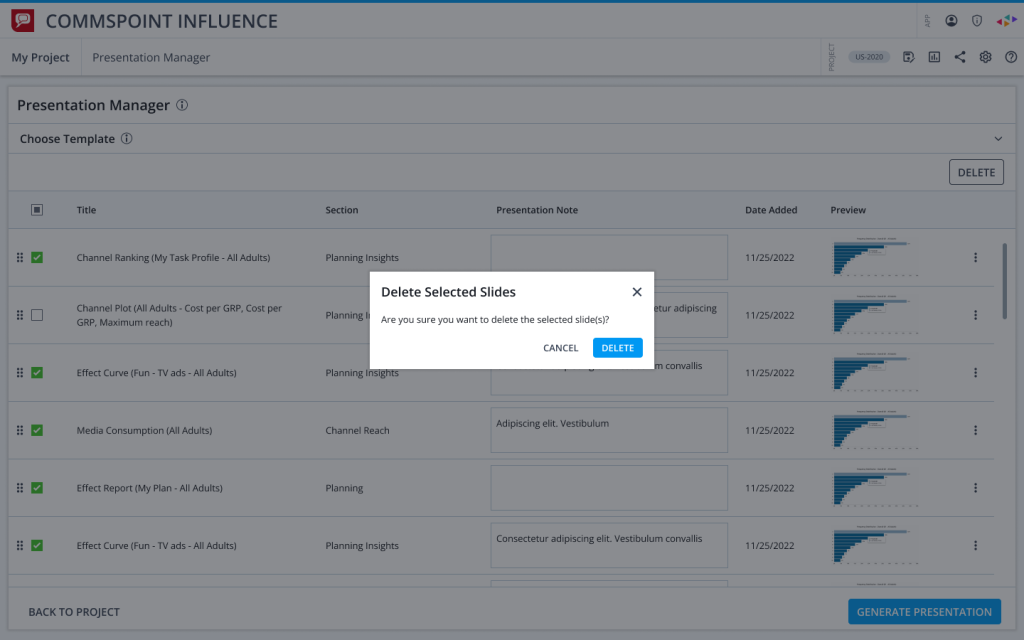
The final interface focused on clarity, task completion, and reducing unnecessary friction.
The design supported the core workflow users needed most: adding charts, managing selected content, previewing slides, applying templates, and generating presentations.
The goal was to keep the V1 experience focused and easy to understand, while leaving room for validated improvements in future iterations.
Every design decision was connected back to what we learned from user behavior during research.
What I Learned
This project reinforced an important lesson: in complex product transitions, the challenge is not always designing more. Sometimes the most valuable contribution is helping the team decide what not to build yet.
By validating the core workflow early, we avoided unnecessary complexity and helped the team move forward with stronger confidence.
Looking back, I realized that involving Product and Engineering earlier around assumptions and hypotheses could have accelerated alignment and reduced uncertainty even further.
Since then, I have focused on bringing cross functional teams closer into discovery activities from the beginning of projects.