Presentation Manager Usability Test
Project for: Nielsen Media Research / Commspoint
Problem Definition
The core challenge of this project was migrating our existing desktop application to a web version while lacking clear visibility into which features users actually relied on.
From a management perspective, the initial instinct was to include every feature in the web version to reduce risk.
However, this approach would have significantly increased complexity, development time, and cognitive load for users.
The real problem was deciding what truly mattered for a first web release based on real usage, not assumptions.
Discovery and Research
I started by working closely with product and engineering to understand the business goals and technical constraints. Then I conducted user interviews and analyzed usage patterns from the desktop application to understand which features were used most often, which were critical for daily workflows, and which were rarely used or had workarounds.
This helped us move away from opinions and toward evidence-based decision-making.
Key Insights
The research showed that a relatively small set of features delivered most of the value. Several features that stakeholders assumed were essential were either rarely used or only relevant for edge cases. At the same time, a few core workflows clearly sat at the heart of how users worked under time pressure.
Research Strategy and Decision Framework
Based on these insights, I worked with stakeholders to define a clear prioritization approach. We decided to launch a focused V1 that covered the most critical and most frequently used features. Lower-priority and edge case features were intentionally planned for V2.
This approach reduced complexity, shortened time to market, and allowed us to validate assumptions early.
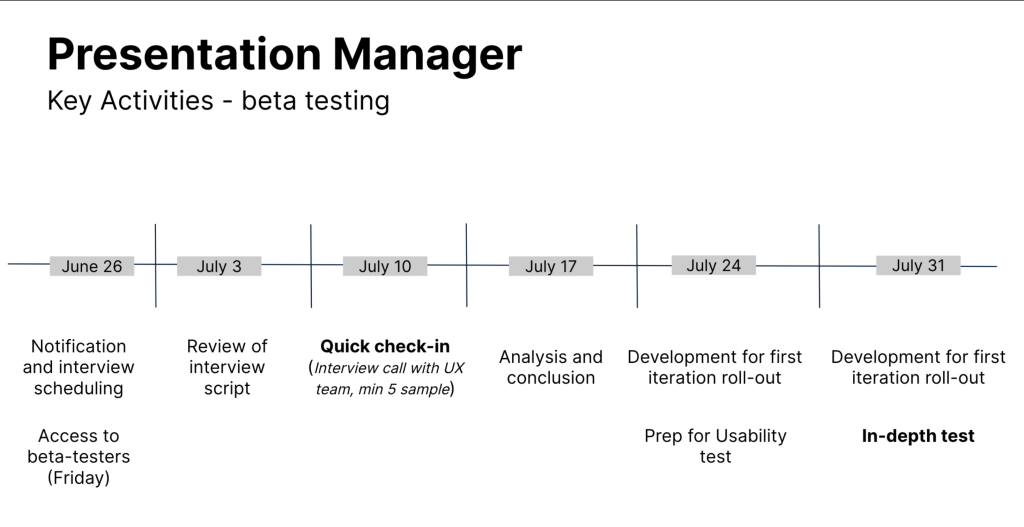
Planning
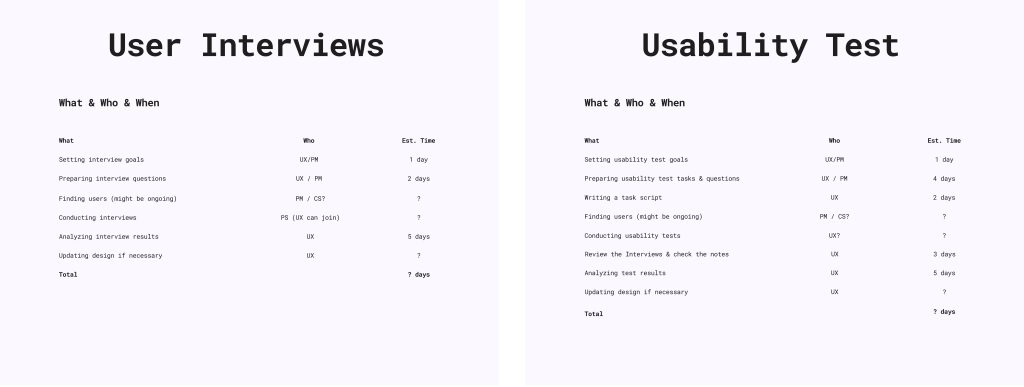
Success Metrics (HEART)
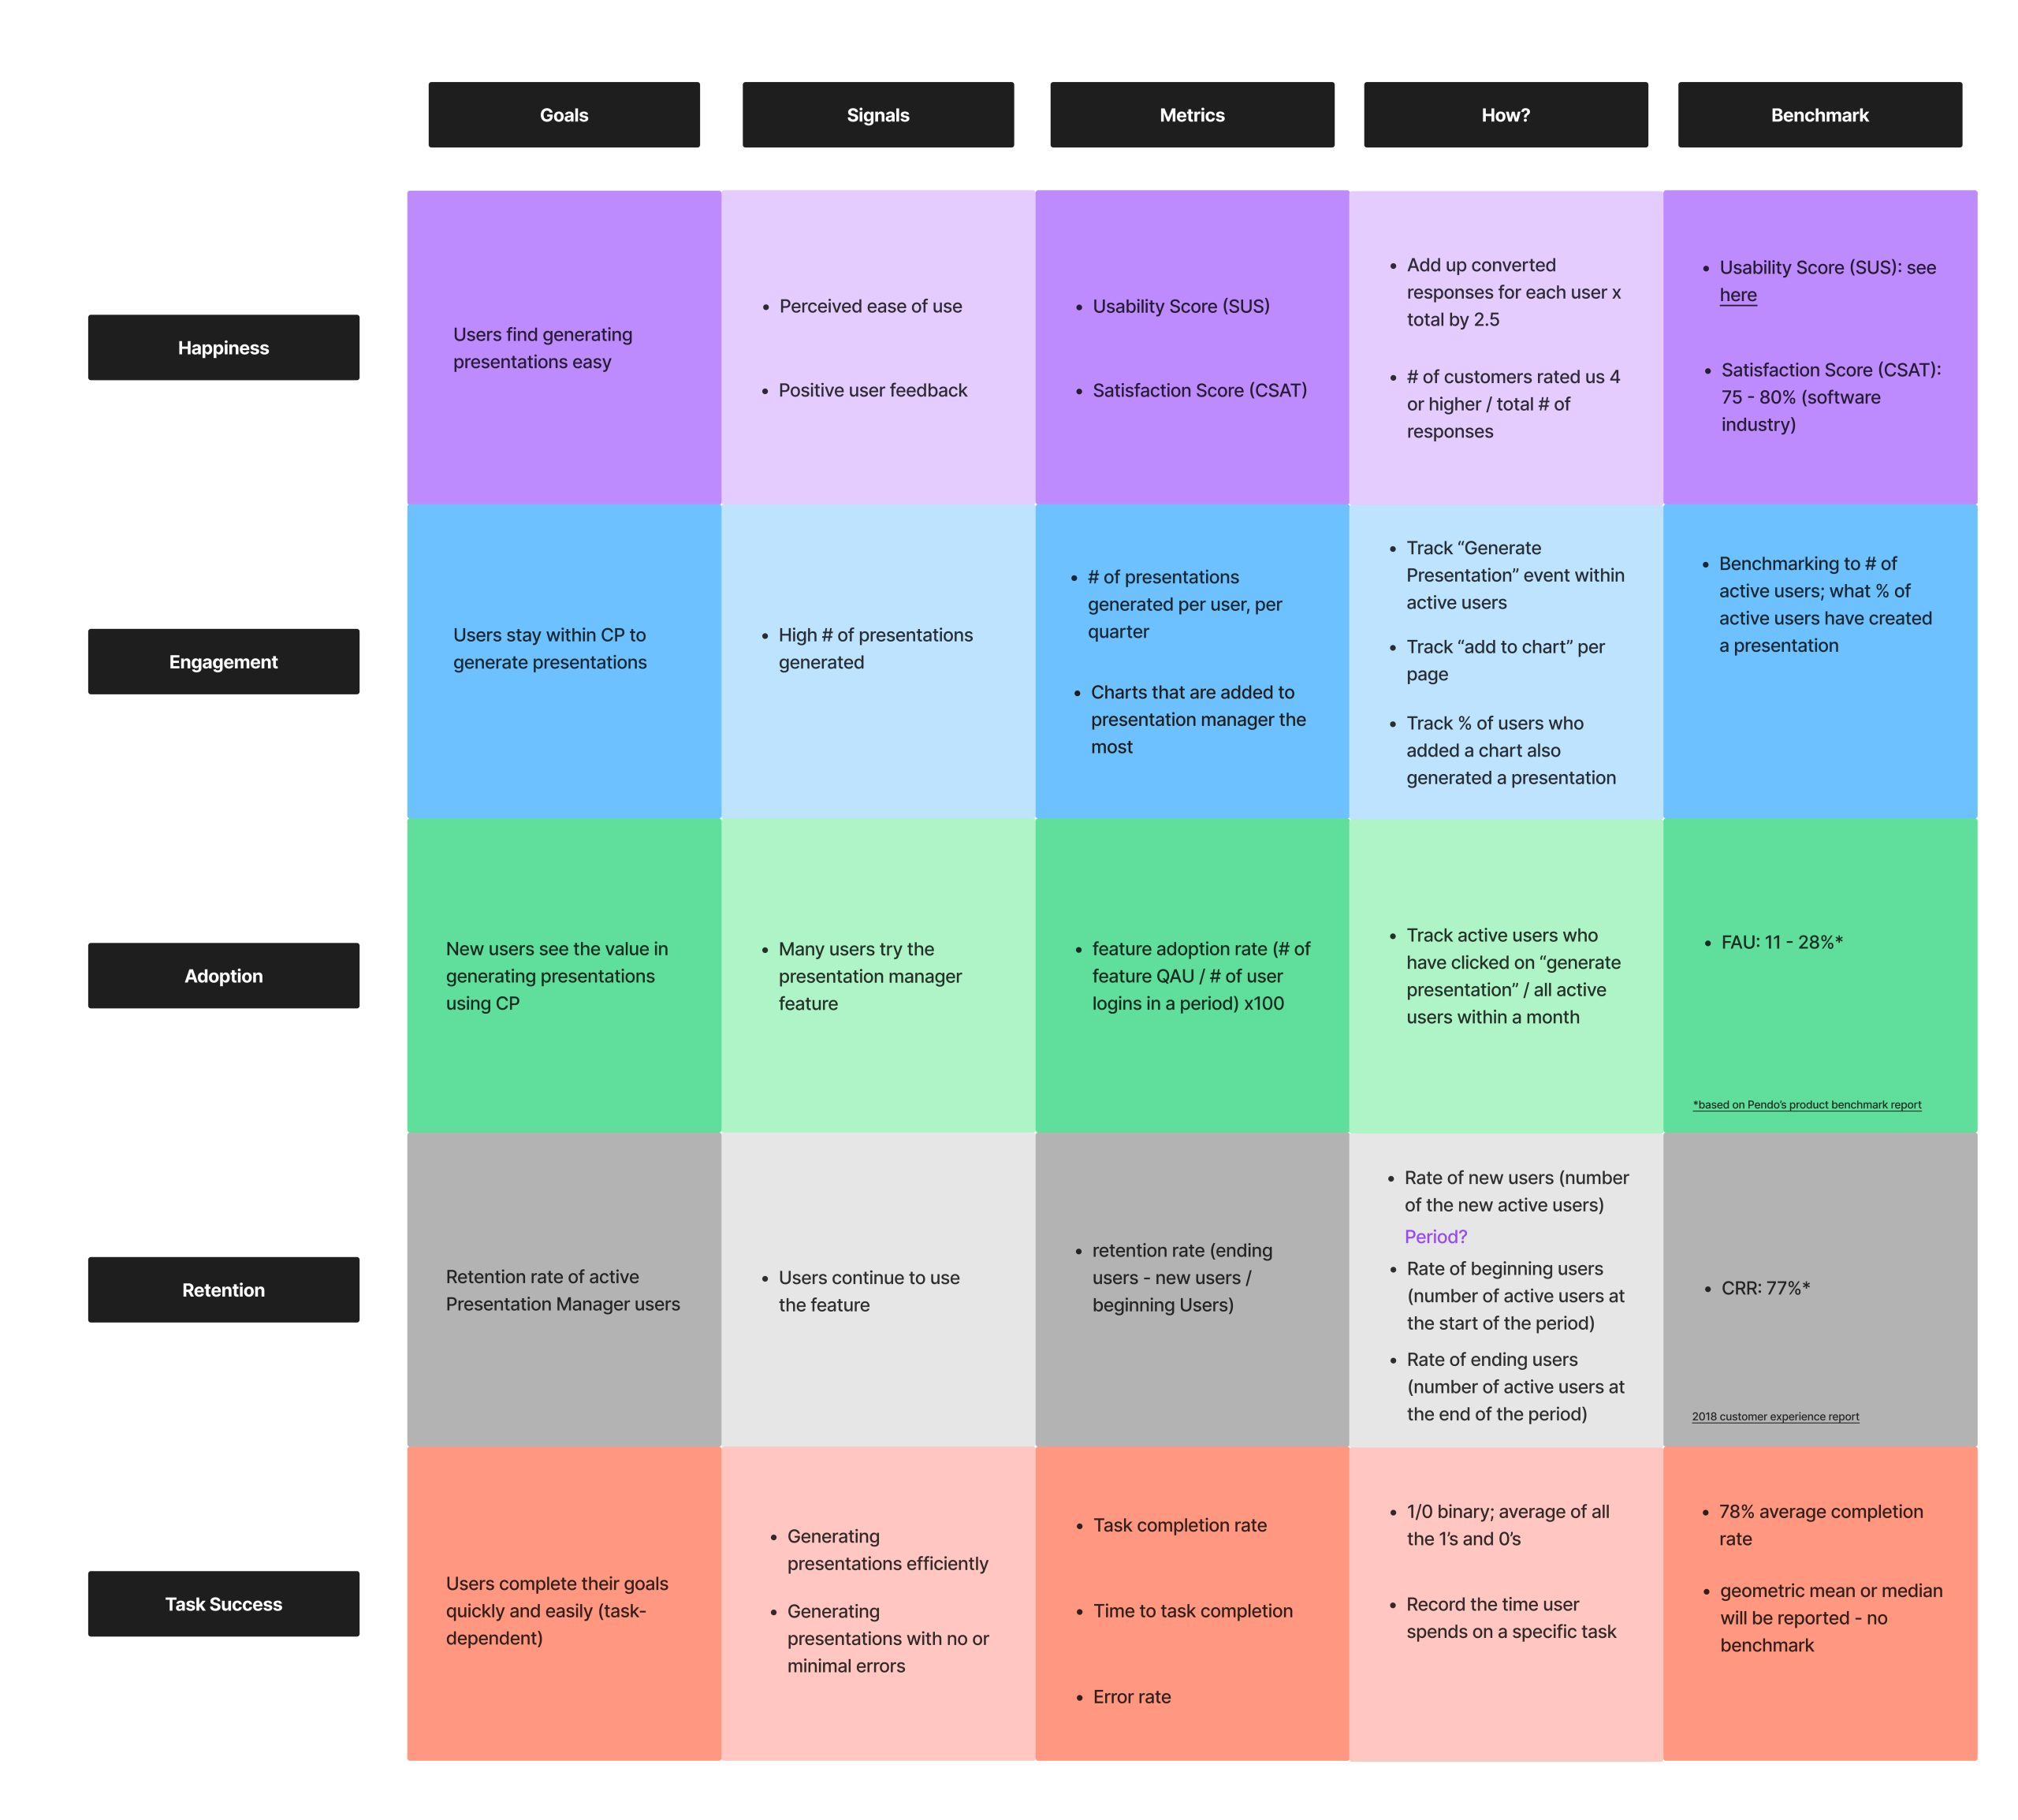
Success Metrics and Validation Using the HEART Framework
To validate that our decisions were correct, I introduced the HEART framework to define success metrics.
Happiness focused on user clarity and confidence.
Engagement measured how deeply users interacted with the core V1 features.
Adoption measured how quickly new users saw value and successfully created their first presentations.
Retention measured continued usage over time.
Task Success evaluated completion rates and error reduction in critical workflows.
These metrics allowed us to continuously test and adjust our decisions.
Template e-mail For The Interviewees
Email Subject Line: [Tool name] Presentation Manager Usability Test Invitation
Hello [Insert Name],
I am [insert name] from Nielsen [team name].
Thank you for being a part of our usability testing to improve our product.
Our team is kicking off this initiative to collect feedback from users to help improve the usability of a new feature, “Presentation Manager” that’s going to be launched soon.
This usability test consists of an interview, starting on July 28th, 2023 Please let us know if you would like to be part of the interview.
Interview details
– We’re going to ask you a few questions to see what you think of the feature and whether it has anything you like or dislike.
General interview guidelines
– The interview will be for approximately 60 minutes and will be remote video calls via Google Meet.
– The interview will be recorded (with your permission) for internal Nielsen reference, we can talk about what this means in detail before the session starts.
Please be aware that our aim is only to test this feature, not you or your way of using this tool.
You don’t need to prepare anything for this session unless you don’t want to, we are just looking for your thoughts and feedback.
Usability Testing Script
Introduction
Hello, first of all, thank you for taking the time to be here today. My name’s [moderator], I’m a part of the UX team for Commspoint and I’ll be walking you through today’s session. A few of my colleagues are also on the call, mainly to listen in to help take notes.
We’ve invited you here today to try out the Presentation Manager feature that will allow our clients to create a presentation using the charts inside their Commspoint web projects.
I’ll start today’s session by asking you a few questions about your role and work. Then, I will share with you a link that contains the prototype/design for the presentation manager, and I’ll ask you to go through a few scenarios using the prototype while you share your screen with us. In the meantime, we’ll also have a casual chat about what works for you and what doesn’t in the screens that you are interacting with.
Please try to go through these tasks or scenarios as if you were using them in your own work and please “Think aloud”. Tell me your thought process as you go about using them; e.g., what it is you are trying to do, what you are looking for, any decisions you are making.
If you get stuck or feel confused, I’d like to hear those too. Just remember that anything you do or say might help inform and improve the product design.
Also, please be aware that there are no wrong answers and try to be as honest as possible with your reactions and feelings. We’re having this session to improve this feature; so we are testing the feature, and not you.
If you have any questions as we go, just ask. I may not be able to answer them right away, but if you still have any questions when we’re done I’ll try to answer them then.
With your permission, I’d like to record this call. The recording will only be used to help us figure out how to improve the site, and it won’t be seen by anyone except those with a need-to-know.
Do you have any questions for me now?
*START RECORDING*
Pre-Test Questions
– Can you briefly talk about what you do in your company? What is your role and what responsibilities do you have in your role?
– What are the top three tools that you use that are essential to your workflow?
– How frequently do you use Commspoint?
– For what purposes do you use Commspoint?
– Which pages or features on Commspoint do you use the most?
Presentation Manager
– Are you familiar with the presentation manager feature?
<If yes> Have you used the Desktop version?
<If yes> When did you last use this feature?
<If yes> For what purposes did you use this feature?
<Yes and no> What file types do you typically use for your presentations?
< If requested the feature> What was the main reason you requested this feature?
Tasks & Scenarios
Great, thanks for your responses. Now we can start looking at the feature. The first thing I’d like you to do is to open the URL I am sending you just now. Next, I’ll ask you to share your screen with me. You can do that by clicking “Present now” in the bottom-right corner of our video chat. Before you share, make sure to close anything you don’t want recorded.
Now I will read some scenarios to you and I will ask you to show me what you would do in each scenario using the prototype.
A quick disclaimer: since this is only a design and not an actual production environment, not everything you see will be clickable. Importantly, the design contains elements that represent our long-term vision for the presentation manager, so some of the elements might be built in the long term.
Prompting questions to keep in mind throughout:
– What would you expect?
– What are you trying to do right now?
– What is going through your mind right now?
– How did this compare to your expectations?
– What are your thoughts on how that worked?
– That link isn’t working in the prototype. What would you expect to happen if you clicked it and it was working?
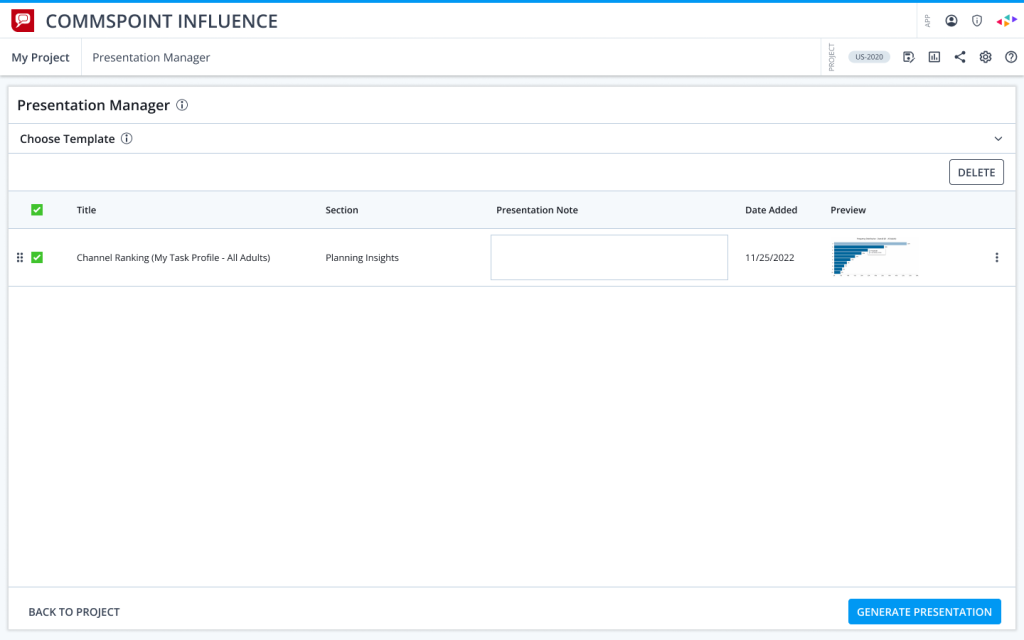
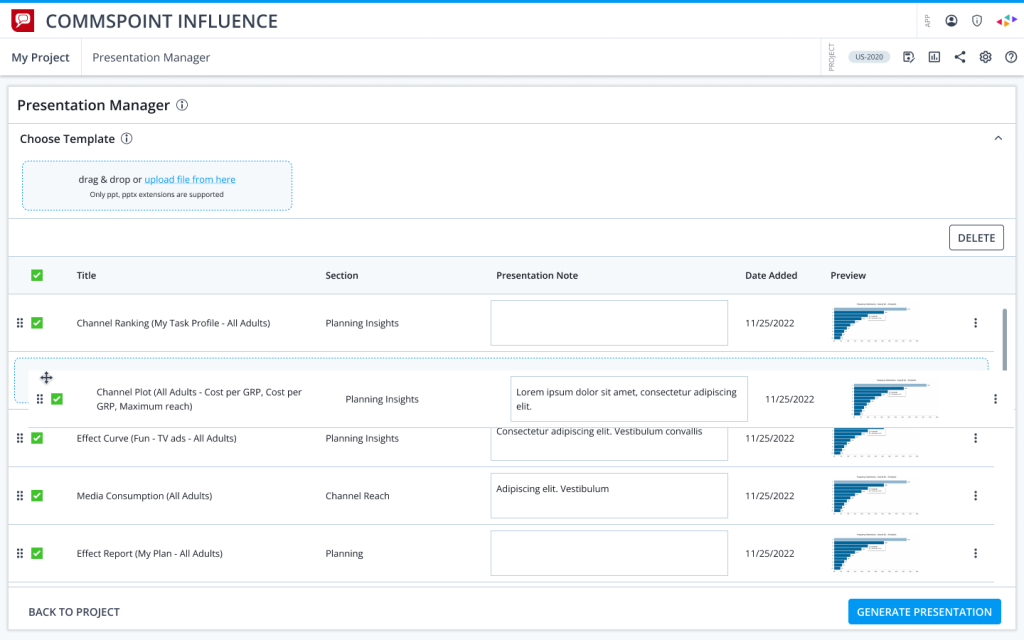
Task 1: Add chart to Presentation Manager
“You have an important meeting with a client and you want to create a presentation for this meeting. This presentation has to include the Channel Ranking chart in your Commspoint project. Show me how you would add the Channel Ranking chart to your presentation, on this page?’
Ideal Flow: Channel Ranking > Add
The task is successful when: User clicks on “Add the chart to presentation manager”
On a scale from 1 to 7 (1= very difficult, 7=very easy), how easy or difficult was this task for you?
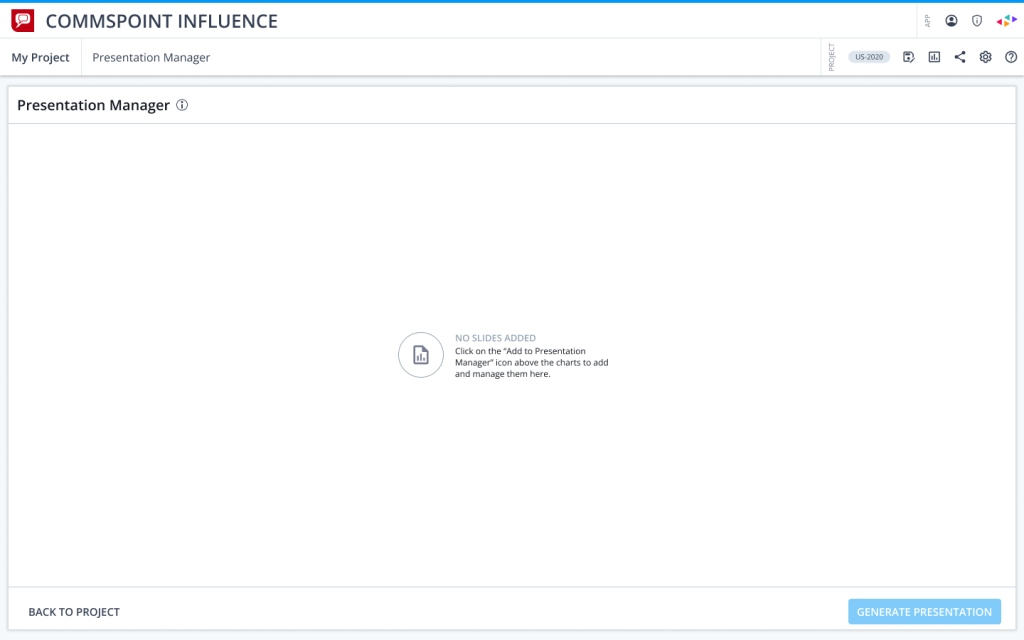
Task 2: Find and go to the Presentation Manager page
“Now you would like to view the contents of your presentation. How/where would you do this?”
Ideal Flow: Click on the Presentation Manager icon
The task is successful when: User clicks on the Presentation Manager icon
On a scale from 1 to 7 (1= very difficult, 7=very easy), how easy or difficult was this task for you?
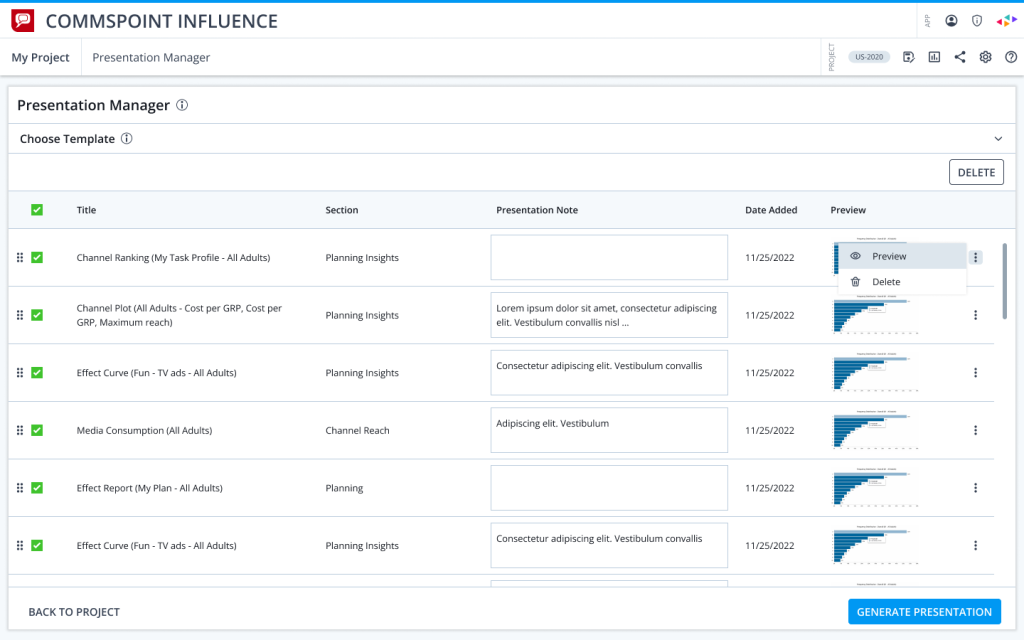
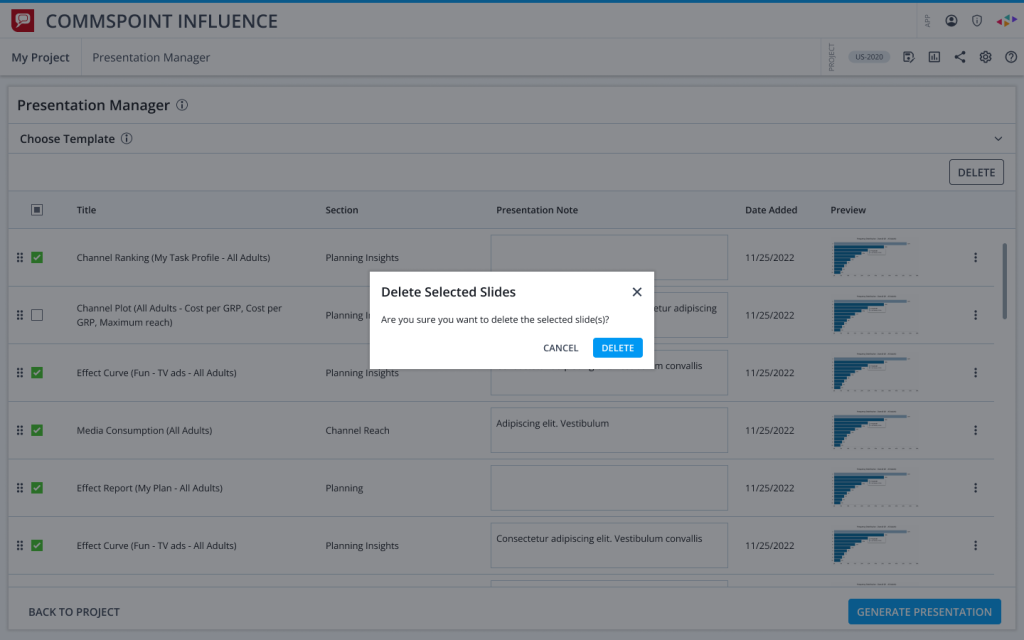
Task 3: Delete chart
“You realized that there is an extra chart on this page that you don’t need on your presentation, the Effect Curve chart. How would you remove this chart from this page?”
Ideal Flow: Unselect Channel Ranking + Channel Plot + Media Consumption > Click Delete > Confirm
The task is successful when: User clicks on Confirm in the Delete dialog
On a scale from 1 to 7 (1= very difficult, 7=very easy), how easy or difficult was this task for you?
Task 4: Preview charts
“Next, you want to check what the Channel Ranking slide will look like, without leaving this page. How would you do it?”
Ideal Flow: Click to the Thumbnail or Click the 3 dots menu > Click Preview
The task is successful when: User clicked on The Thumbnail
On a scale from 1 to 7 (1= very difficult, 7=very easy), how easy or difficult was this task for you?
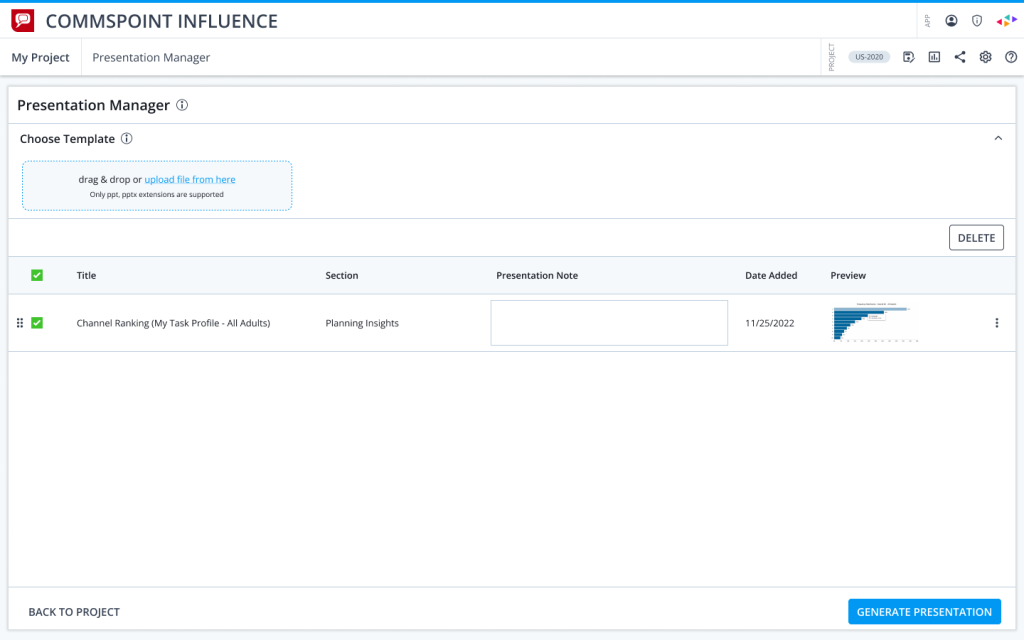
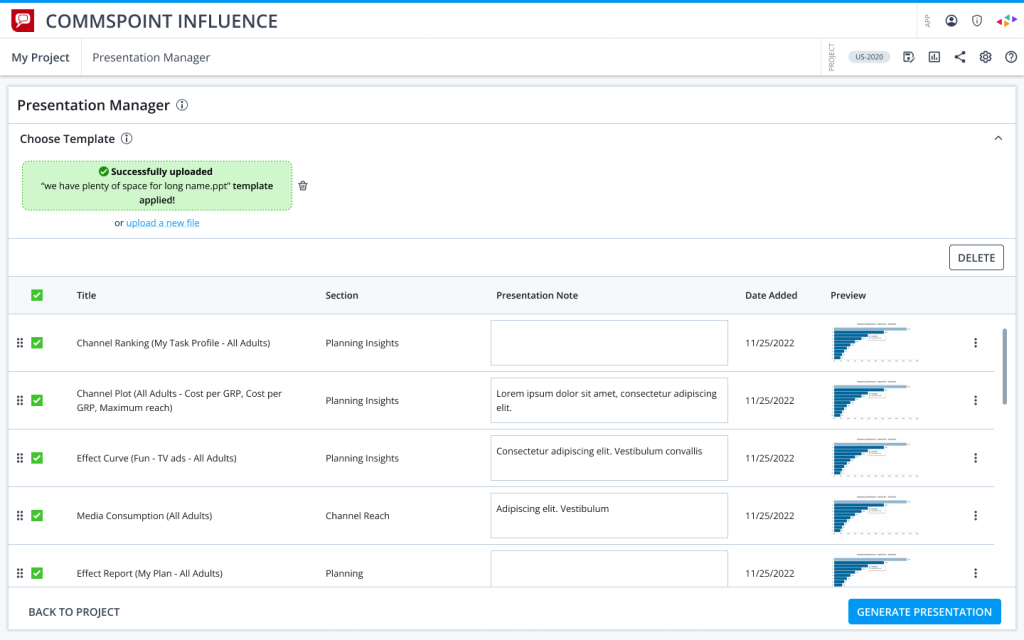
Task 5: Use a template
“Next, you want to add a template to your presentation to customize it. How would you do this?”
Ideal Flow: Expand Template area > Read Info (Optional) > Open Dialog > Choose File > Upload File
The Task is successful when: User uploads a template
On a scale from 1 to 7 (1= very difficult, 7=very easy), how easy or difficult was this task for you?
Task 6: Remove a template
“Can you also show me how you would remove the template you just added from this presentation?”
Ideal Flow: Click on the “Delete” icon
The task is successful when: User has clicked “delete” icon
On a scale from 1 to 7 (1= very difficult, 7=very easy), how easy or difficult was this task for you?
Task 7: Generate a presentation
“Lastly, you want to create your presentation with the Channel Ranking chart. How would you do this?”
Ideal Flow: Select the Channel Ranking slide (if the user doesn’t have selected one) > Click Generate Presentation
The task is successful when: User clicks on Generate Presentation
On a scale from 1 to 7 (1= very difficult, 7=very easy), how easy or difficult was this task for you?
Interview Questions
Now, please think about your overall experience of using Presentation Manager.
On a scale from 1 to 5 (1= very dissatisfied, 5=very satisfied), how satisfied are you with the presentation manager feature? Why?
– What, if anything, you liked about this feature? Why?
– What, if anything, you disliked about this feature? Why?
– Was the language clear for you? (for tooltips and explanations)
– Was the navigation as expected?
– If you could change anything in this design, what would it be? Why?
– <If the user is familiar with the feature from the desktop version> Compared to the desktop version of Presentation Manager, what do you think of this version?
Is it better, worse, or about the same? Why?
– How valuable might this feature be in your workflow?
– Anything we haven’t asked you that you think would be valuable for us to know?
Closing Remarks
Thank you for your feedback, this has been extremely insightful and helpful.
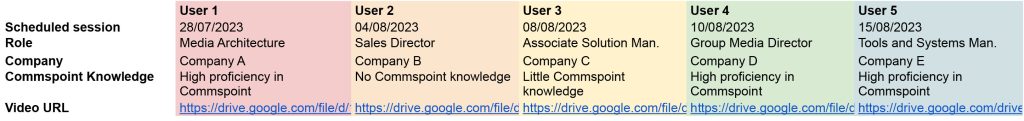
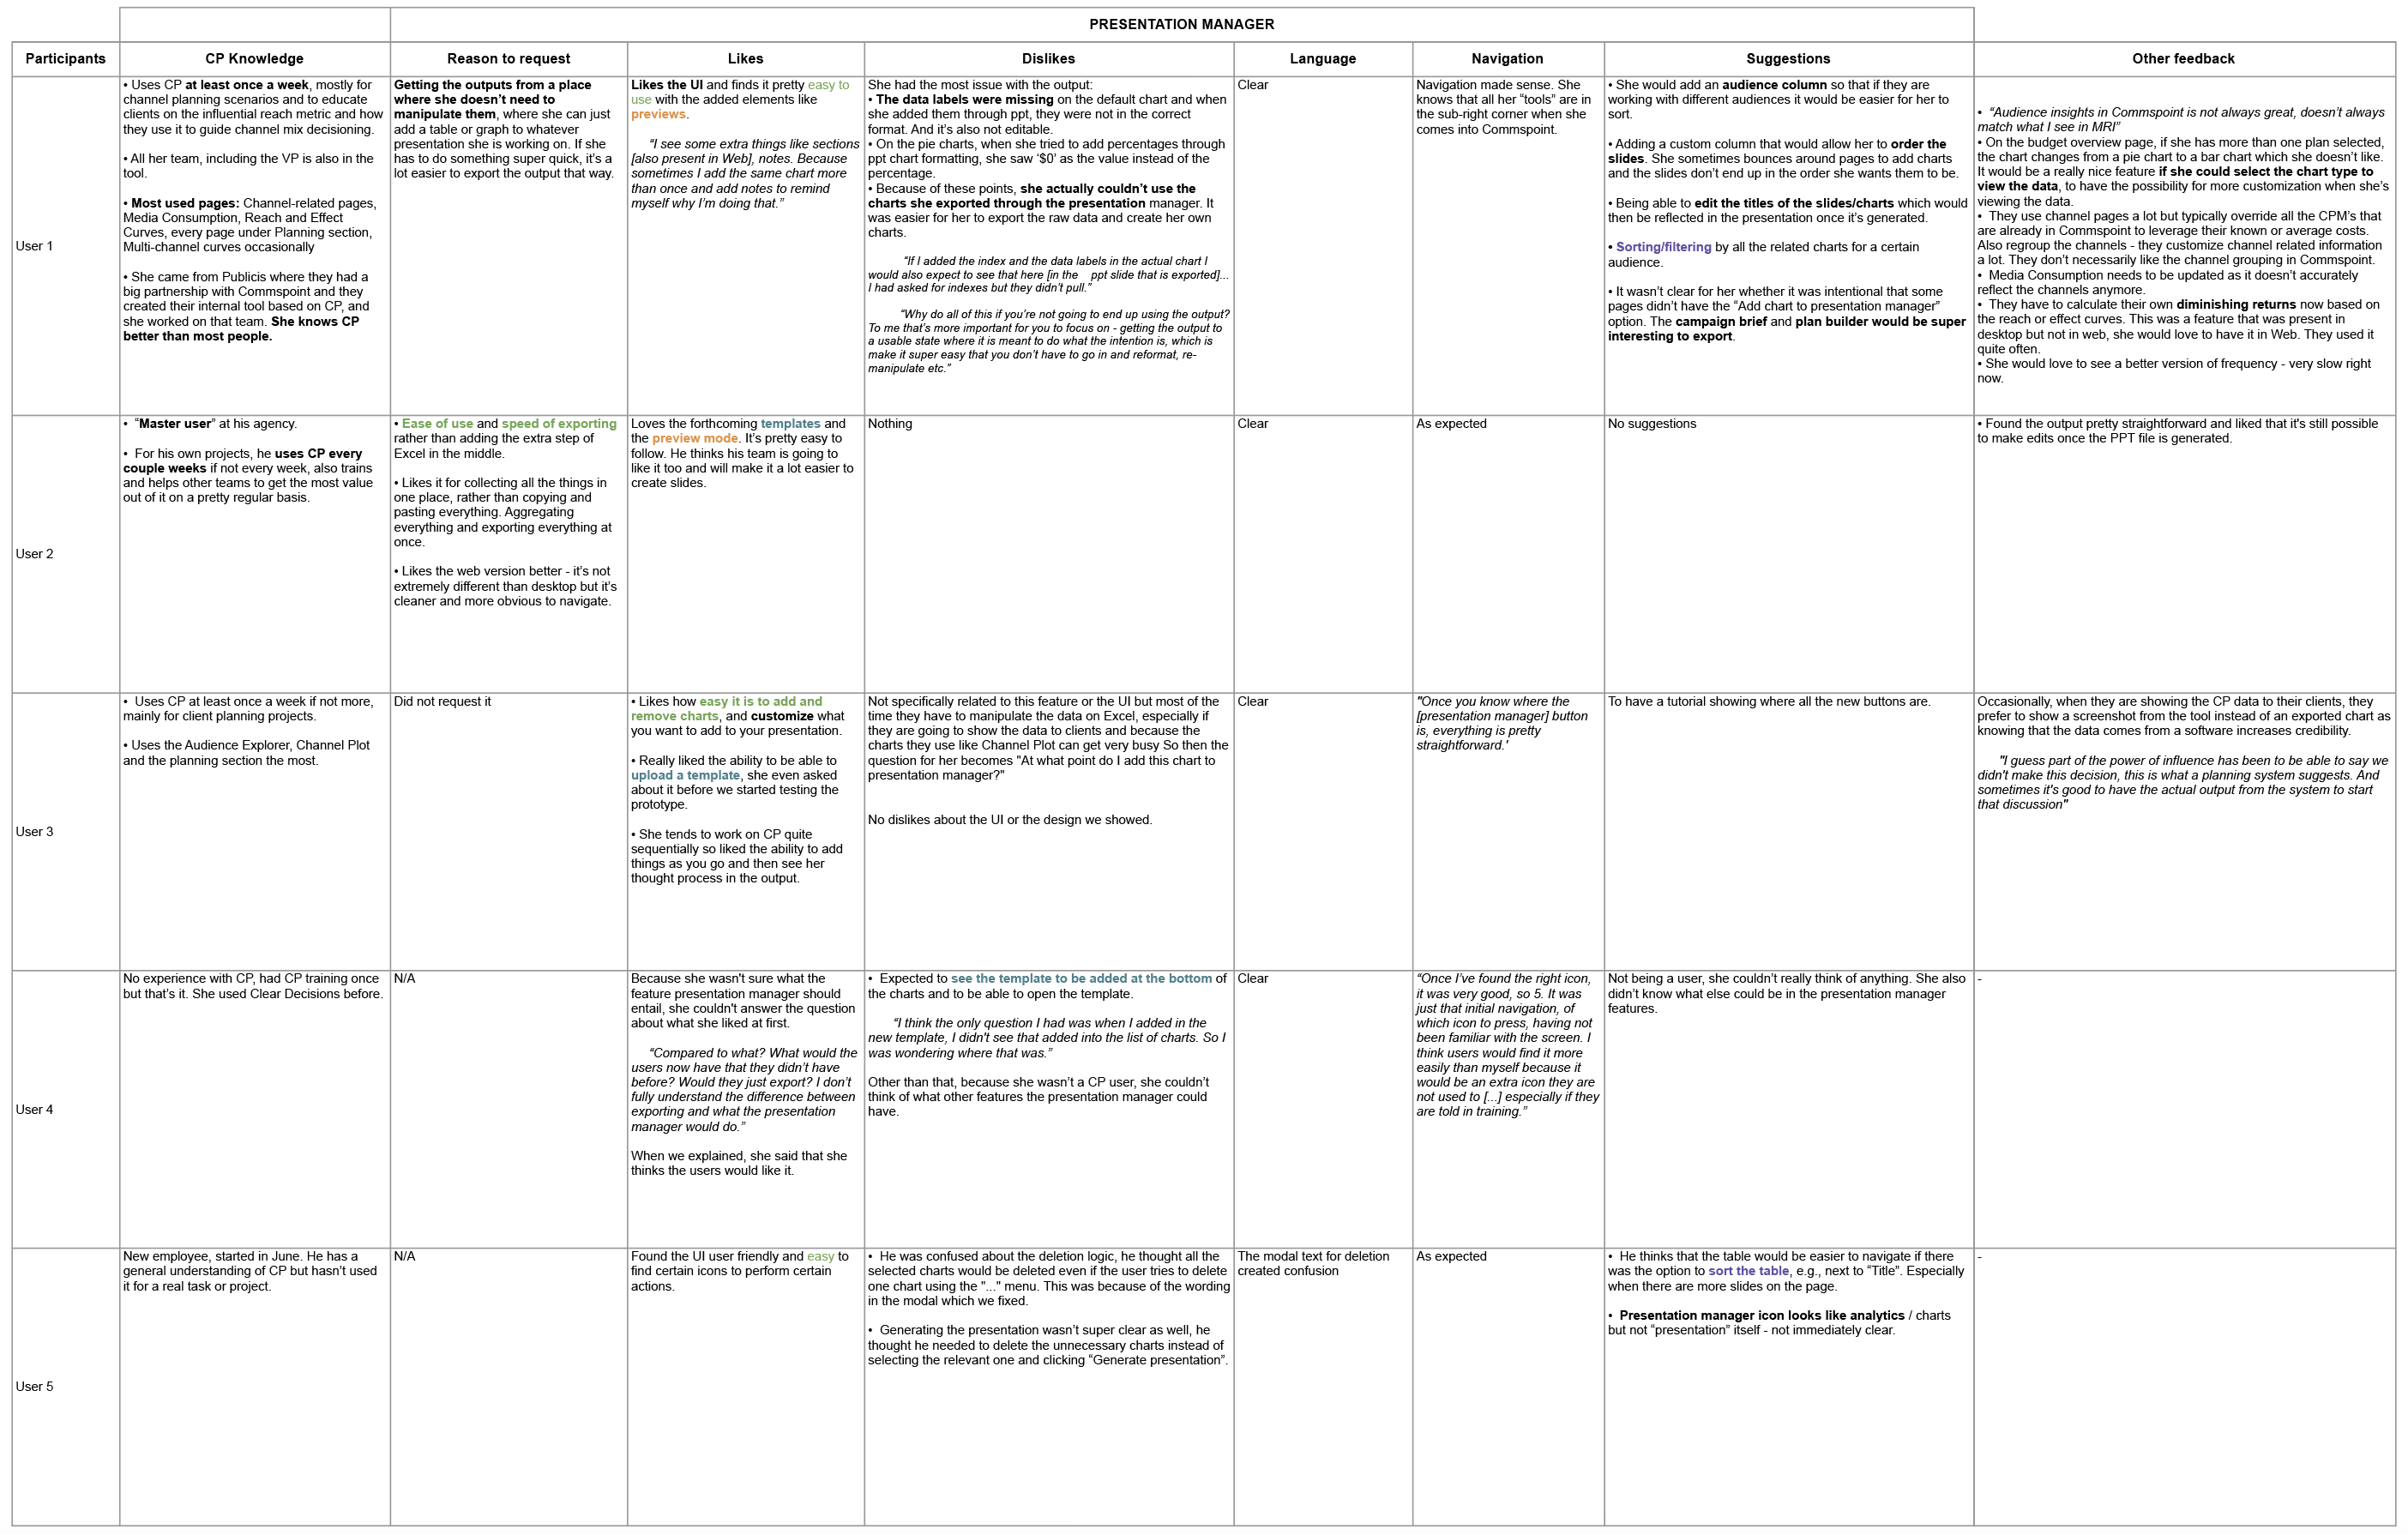
Participants
Task notes

Metric Results
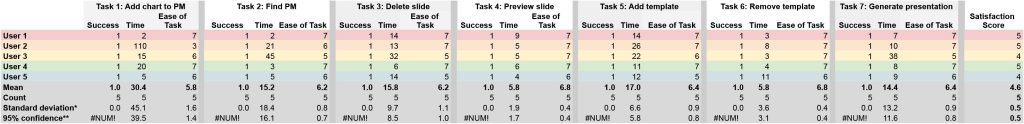
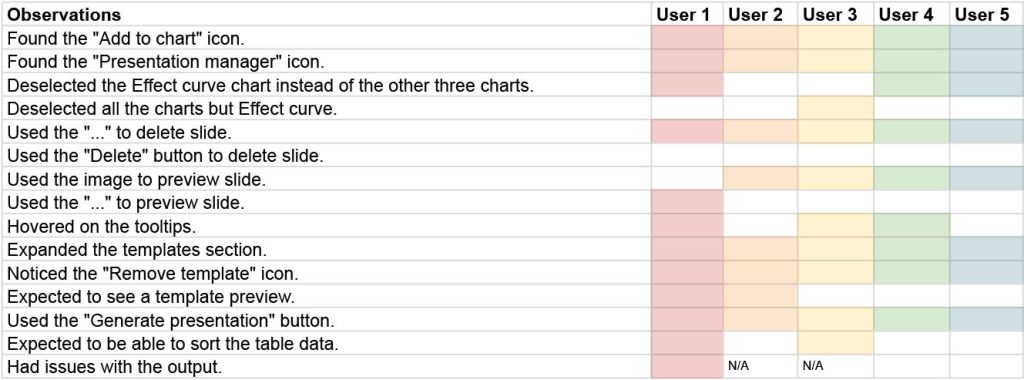
Observations
Findings
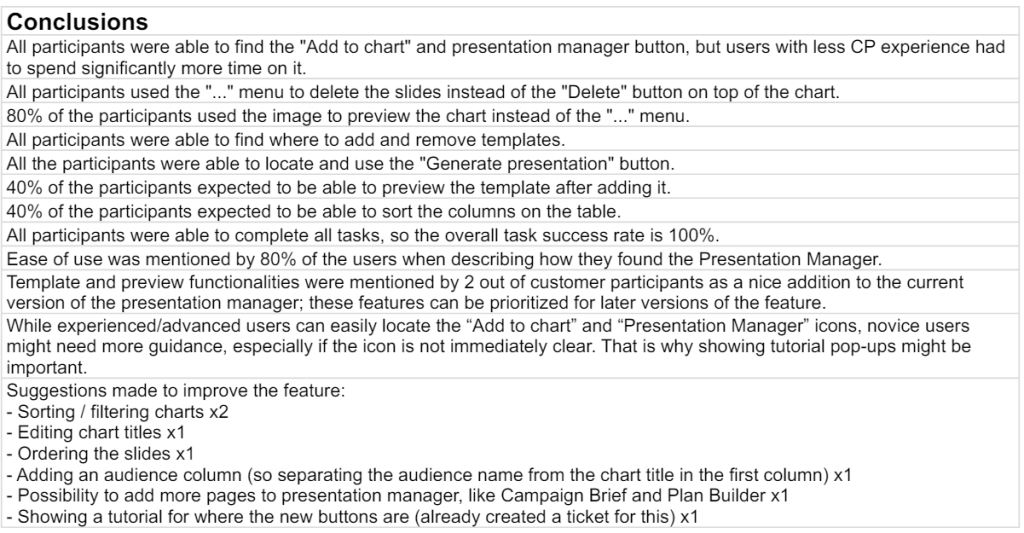
Conclusion
Outcome and Impact
After launching V1, we received very strong user feedback. Users described the web version as faster, clearer, and more focused. Adoption was smooth, and the team gained confidence in the roadmap for V2.
Most importantly, this project established a stronger culture of research driven and test-backed decision-making across the team.
UI Examples