
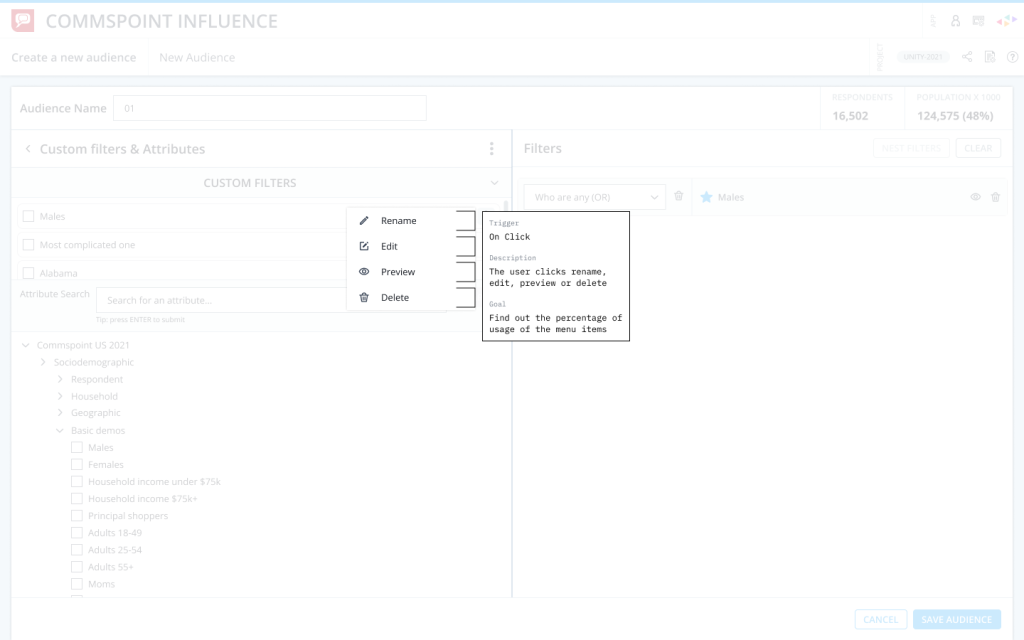
Creating Feedback Pool & Tag System
Project for: Nielsen Media Research / Commspoint
Project Time: 18 Months
My Role
I initiated and led this project from the ground up.
I identified the gap in how product decisions were being made, proposed the idea of a structured feedback system, and aligned stakeholders across management, product, UX, QA, and Customer Support.
I defined the system logic, designed the tag structure, and coordinated cross-team collaboration to ensure consistent data flow across all channels.
This required continuous communication, multiple workshops, and long-term alignment across departments.
The entire process, from idea to implementation, took approximately one and a half years.
About the Project
This project was initiated and led by me to solve a fundamental gap in how product decisions were being made.
I identified that most feature requests were coming from project management without a clear understanding of whether they were based on real user needs. There was no structured way to validate requests, no direct communication with users, and no system to identify recurring pain points.
I presented this problem to management, design, and product teams, and proposed creating a centralized feedback system based on real user signals.
After alignment, I led the initiative, defined the system structure, coordinated multiple departments, and drove the implementation process over approximately one and a half years.
Problem Definition
The main problem was not the lack of ideas or feature requests.
The problem was the lack of clarity behind those requests.
Most inputs were coming from project managers, but the source of those requests was often unclear. There was no consistent process to validate whether these inputs reflected real customer needs or expectations.
Customers were not directly involved in the process. Feedback was mostly indirect, coming through occasional conversations handled by customer representatives. This made it difficult to understand actual user pain points and nearly impossible to identify recurring patterns.
This created a situation where product decisions were often based on assumptions rather than validated user needs.
There was no visibility into how often a problem was mentioned, which issues were recurring, or which requests had the highest impact.
As a result, it was difficult to confidently prioritize what should be built next.
It also reduced dependency on individual opinions and created a shared understanding across teams based on visible and repeated user signals.
Objective
The objective of this project was to build a system that could connect product decisions directly to user pain points.
Instead of relying on scattered feedback or internal assumptions, the goal was to create a structured environment where inputs from different departments and channels could be collected, compared, and evaluated together.
This meant creating a system that could answer key questions:
Are we solving real user problems?
Which issues are repeated across different channels?
What should be prioritized based on impact?
The goal was not only to collect feedback, but to make it usable for decision-making.
Approach
I approached this project as a system-level problem rather than a design task.
The issue was not limited to UX. It was affecting how the entire organization collected, interpreted, and used feedback.
To solve this, I focused on connecting different departments and creating a shared structure that could support consistent feedback collection and evaluation.
This required working closely with UX, QA, Customer Support, Product Management, and other stakeholders. The process involved frequent communication, continuous alignment, and multiple planning sessions to ensure that each department could contribute to the system in a meaningful way.
The work was not only about defining a structure. It was about creating a shared understanding across teams.
The entire process took approximately one and a half years, including research, planning, alignment, and
implementation.
Core Idea
After identifying how feedback was flowing and where it was breaking, the next step was to create a system that could turn this input into something measurable and actionable.
After defining the flow and identifying the gaps, the next step was to create a structure that could turn feedback into measurable signals.
The core idea behind the project was to shift from feature-driven thinking to pain-point-driven decision-making.
Instead of asking what we should build next, the system focuses on understanding what users are struggling with and why.
This required collecting signals from multiple sources, identifying recurring problems, and structuring them in a way that makes patterns visible.
The system was designed to highlight real user pain points rather than isolated feature requests.
How the System Works
The system was built around a centralized feedback pool supported by a tag-based structure.
Each piece of feedback collected from different departments was tagged based on product area, problem type, and context.
As more feedback was added to the system, repeated issues started to surface naturally.
The more a specific problem was mentioned across different channels, the more visibility it gained in the system.
This made it possible to identify the most critical user pain points based on frequency rather than assumptions.
In this structure, the most mentioned problems automatically became the most visible ones, helping the team focus on what matters most.
Planned Flow
The planned flow was designed to connect all feedback channels into one structured system.
Instead of keeping feedback inside separate departments, the goal was to create a unified flow where inputs from UX, QA, Customer Support, analytics, and product teams could move into a shared feedback pool.
This flow shows how raw input from different sources is collected, structured, and transformed into product signals that can support decision-making.
It also highlights how feedback moves from isolated observations into a centralized system where patterns and priorities become visible.
Please click the image to see the detailed flow
This flow represents the initial system design created to align different departments and define how feedback moves across the organization.
Understanding the Flow Structure
The flow is divided into sections to clearly represent how product direction and feedback channels are connected.
The purple area represents Management Direction, including long-term and short-term plans. This section defines the strategic vision of the product. However, without direct and structured input from users, these decisions may not fully reflect real user needs. For this reason, the feedback system was designed to support and validate management decisions with actual user signals.
The yellow area represents the Product Roadmap. This is where product managers combine management direction with structured feedback collected from different channels. The goal is to create a roadmap that is not only aligned with business goals but also supported by real user problems.
The main feedback channels are divided into three core areas: UX, QA, and Customer Support. Each of these channels provides a different type of product signal and contributes to the overall feedback system.
The dark green boxes represent sub-channels that already provide consistent data flow and are compatible with the tag system. These channels are actively contributing structured feedback to the system.
The light green boxes represent sub-channels that partially provide data flow but are not yet fully aligned with the tag system. These channels require further structuring to become more effective.
The grey boxes represent sub-channels that currently do not provide sufficient feedback data and need to be developed. These areas were identified as opportunities to strengthen the system and improve coverage across the product.
This structure helps visualize not only where feedback comes from, but also how mature each channel is and how it contributes to product decision-making.
This also made it easier to identify gaps in the system and prioritize which channels needed improvement.
This structure helped reveal not only how feedback flows across the organization, but also where the system was incomplete or missing data.
These gaps became the starting point for building a more structured and scalable feedback system.
This also helped identify gaps in the system and prioritize which channels needed improvement.
UX Section & Sub Tasks
UX Inputs (Suggestions): We are listing important UX issues about the CP
The UX section was designed to capture user experience-related signals and bring them into the feedback system.
This includes usability findings, user research insights, behavioral patterns, analytics observations, and direct UX evaluations.
The goal of this section is to identify where users struggle, where they experience friction, and which parts of the product require improvement.
By adding UX input into the feedback pool, these insights can be compared with data from other departments, helping the team understand whether a problem is isolated or part of a larger pattern.
Quantitative Feedback (SUS, NPS tests) via TypeForm: In Q1, we performed the SUS test on users with the help of an external tool (TypeForm) in English and Portuguese.
We will also collect feedback using TypeForm to find out how satisfied users are with the presentation manager v1 feature.
CS Department Section & Sub Tasks
The Customer Support section was designed to capture direct feedback from users during real product usage.
Customer Support teams interact with users daily and are often the first to hear complaints, confusion points, and feature requests.
This section brings those insights into the feedback system in a structured way.
Instead of keeping feedback inside tickets or conversations, it becomes part of a shared pool where it can be analyzed, compared, and prioritized.
This helps the team understand which issues are repeated across different users and which problems have the highest impact.
QA Department Section & Sub Tasks
The QA section was designed to include product quality signals in the feedback system.
This includes bugs, technical issues, broken flows, and edge cases that affect the user experience.
QA input is critical because technical problems often directly impact usability and user satisfaction.
By connecting QA feedback with UX and Customer Support signals, the system helps identify which issues affect both product quality and user experience at the same time.
This makes prioritization more accurate and impact-driven.
Why the Tag System Matters
The tag system is what makes the entire feedback pool meaningful.
Without structure, feedback remains as isolated input. With tagging, it becomes measurable and comparable.
Each feedback item is connected to tags, and over time, repeated tags reveal recurring problems.
The more a specific issue is mentioned, the more visible it becomes in the system.
This allows the team to clearly see which problems affect the most users.
Instead of guessing what is important, the system highlights the most critical issues based on how often they appear.
This creates a natural prioritization model where the most mentioned problems rise to the top.
This system changed how product priorities were defined.
Instead of relying on assumptions or individual opinions, decisions could be supported by visible patterns and repeated user signals.
The team gained a clearer understanding of which problems mattered most, and why.
This made product discussions more focused, more objective, and more aligned with real user needs.
This created a dynamic prioritization model where the most mentioned problems naturally surfaced to the top, making it easier to focus on the highest impact issues.
This created a system where feedback was no longer treated as isolated input.
Instead, repeated tags revealed patterns, and the most frequently mentioned problems naturally moved to the top.
This made prioritization more objective, as the system highlighted the most critical issues based on real user signals rather than assumptions.
This created a natural prioritization model where the most mentioned problems automatically surfaced to the top.
Outcome
This project shows how a pain point-driven system can transform scattered feedback into a structured and reliable decision-making model.
By leading this initiative and building a cross-team feedback system, it became possible to replace assumption-based decisions with measurable and repeatable product signals.
The result is a system where the most critical user problems naturally surface, guiding product direction with clarity and confidence.