SUS Research: Identifying Usability Issues and At-Risk Users
Project for: Previous B2B SaaS company
Role: UX Researcher / Product Designer
Methods: SUS survey, quantitative analysis, response segmentation, usability risk analysis
Tools: Intercom, Typeform
I planned and analyzed a System Usability Scale study to evaluate the usability of a B2B tool, identify key friction points, and turn low satisfaction signals into actionable insights.
Instead of only reporting a usability score, I segmented user responses, identified risk patterns, and helped the team take action on users who were likely struggling with the product.
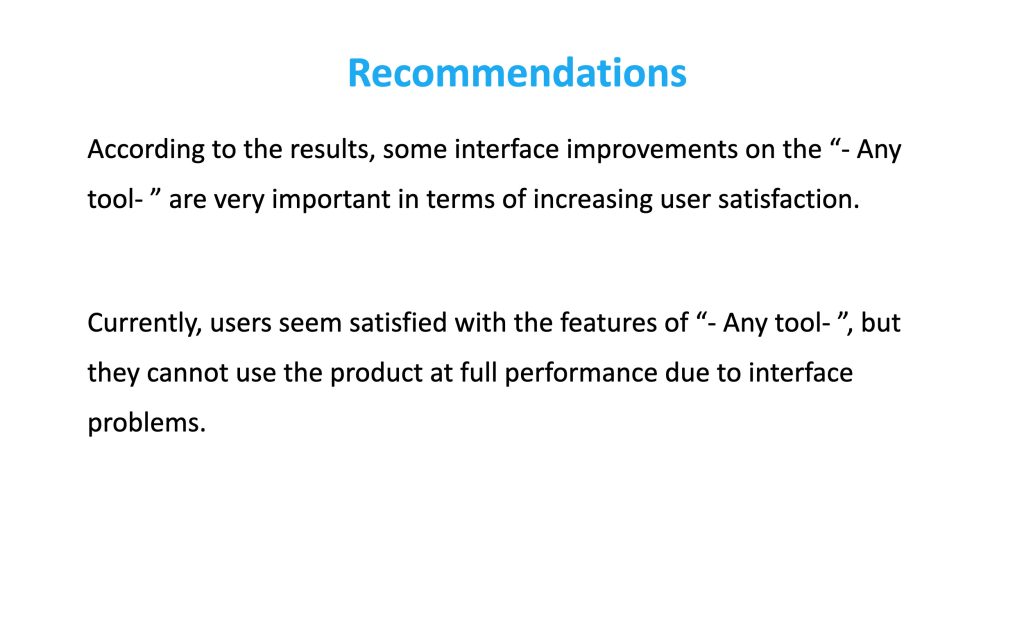
This study revealed that usability issues were not about product value, but about how users interacted with the system.
Impact
This project turned a standard usability survey into an actionable customer health signal. Instead of only reporting an average SUS score, I segmented the responses, identified users with low satisfaction, mapped the strongest positive and negative patterns, and shared clear recommendations with management and customer support.
The outcome was not only a usability score. It helped the team understand which product areas needed improvement and which customers required immediate follow-up.
This project turned a standard usability survey into an actionable customer signal.
I identified users with low satisfaction scores, mapped usability issues, and shared clear insights with product and customer support teams. Users with low SUS scores were later contacted, helping the company support at-risk customers and improve their experience.
This approach helped transform a simple usability survey into a practical tool for identifying product risks and improving customer experience.
Download the anonymous SUS test report from here
Research Setup
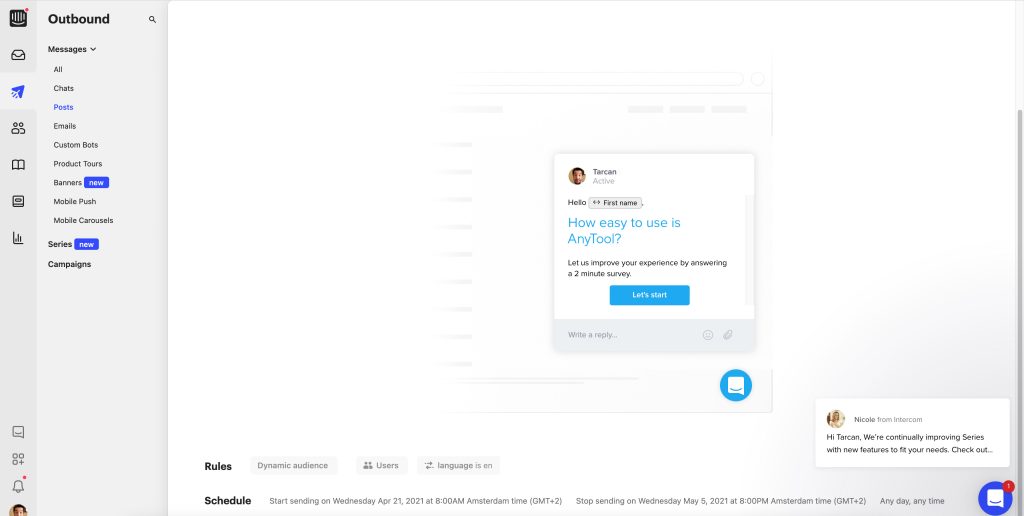
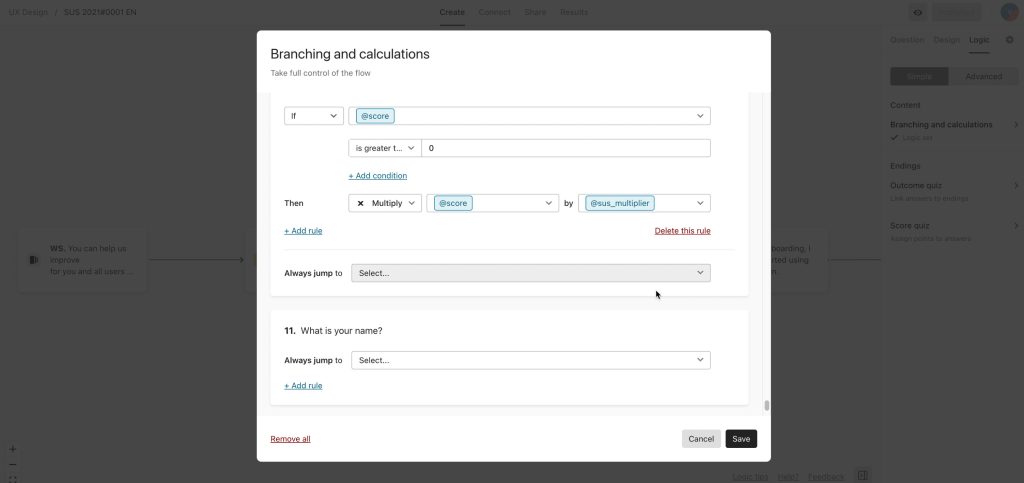
I used Intercom to reach active users directly inside the product and guided them to a Typeform-based SUS survey.
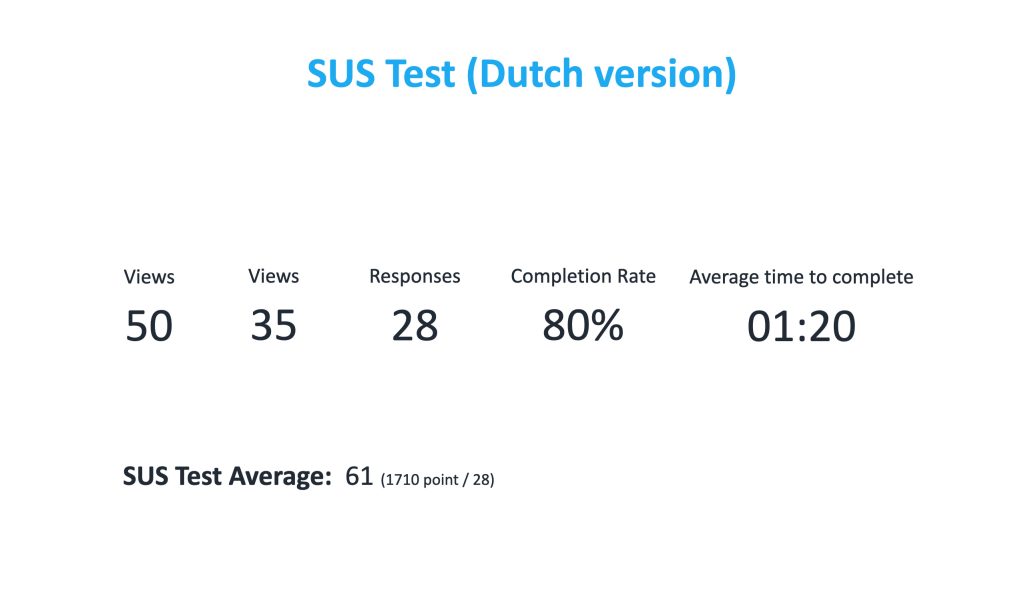
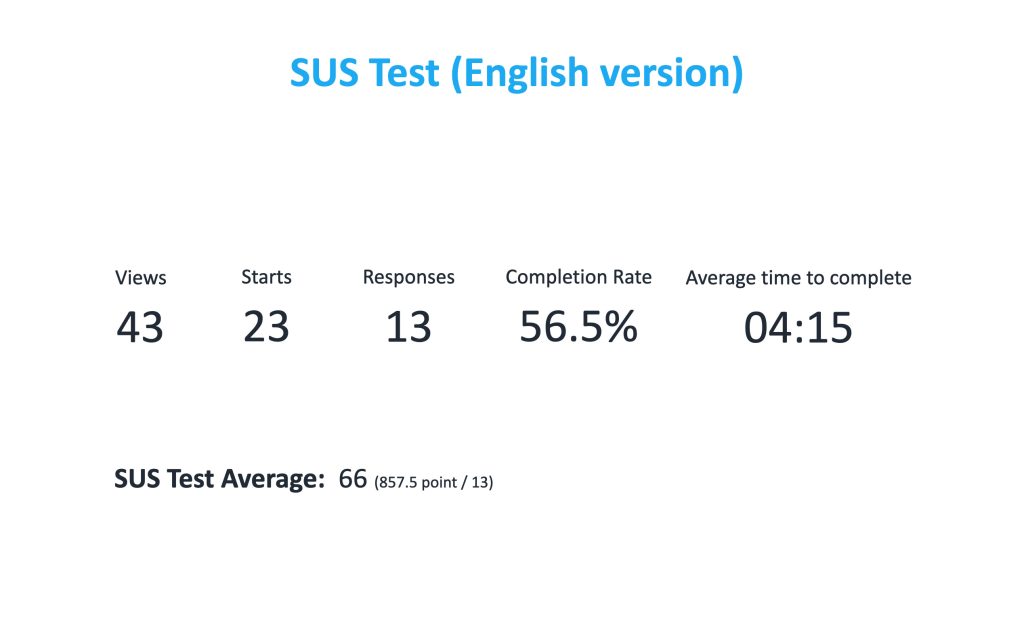
This allowed me to collect feedback in context, while users were actively using the tool. The survey was prepared in both Dutch and English to include different user groups and reduce friction during participation.


Response Rate and SUS Score
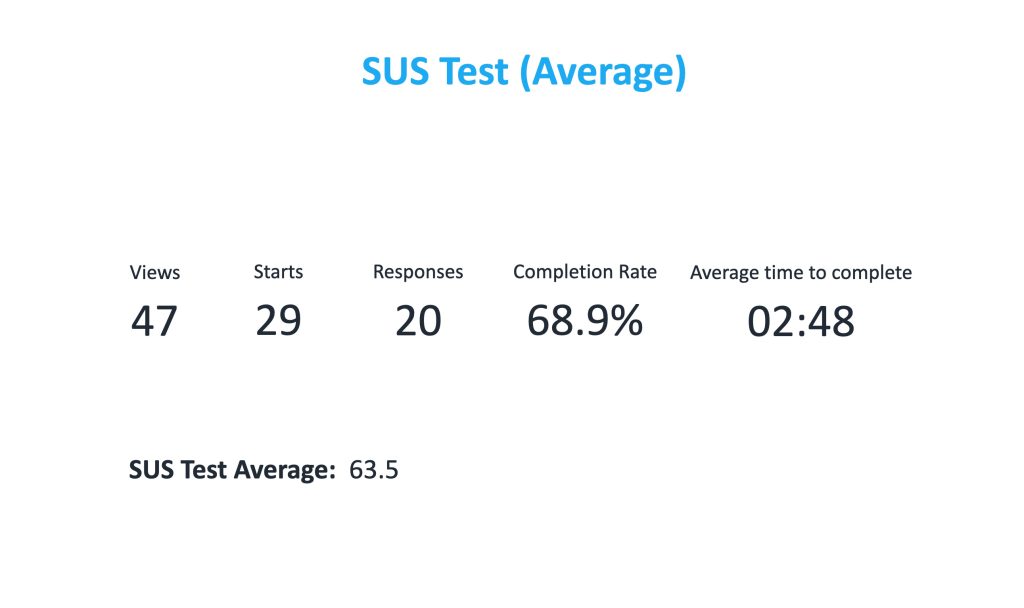
The average SUS score was 63.5, which showed that the product was usable but still below a strong usability benchmark. The result gave us a clear signal: users saw value in the tool, but the interface and interaction quality were limiting the overall experience.
This was an important finding because it separated product value from usability quality. Users did not reject the tool itself. They struggled with how the tool worked.
Since the average SUS score was below the industry benchmark (68), this clearly indicated that usability improvements were necessary.
The average SUS score was below the industry benchmark of 68, indicating clear usability issues that required attention.


Question Level Analysis
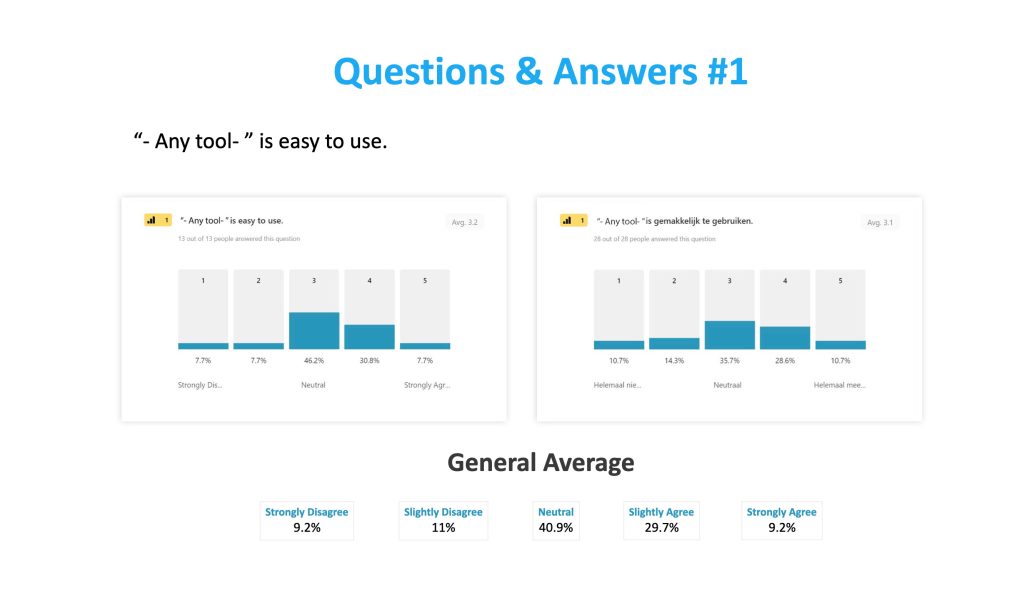
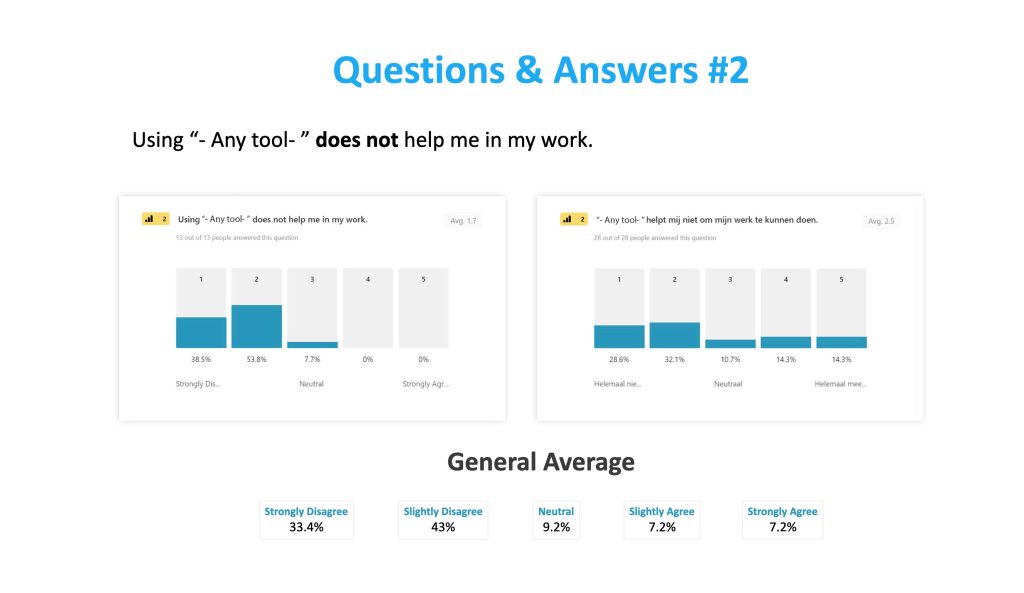
I reviewed each SUS question separately instead of relying only on the final score. This helped me understand which parts of the experience created confidence and which parts created hesitation, confusion, or dependency on support.
This question-level view made the results more useful for product, design, management, and customer support teams.

To better understand the results, I combined question-level insights with response patterns to identify the main usability challenges.

Positive, Negative, and Neutral Response Balance
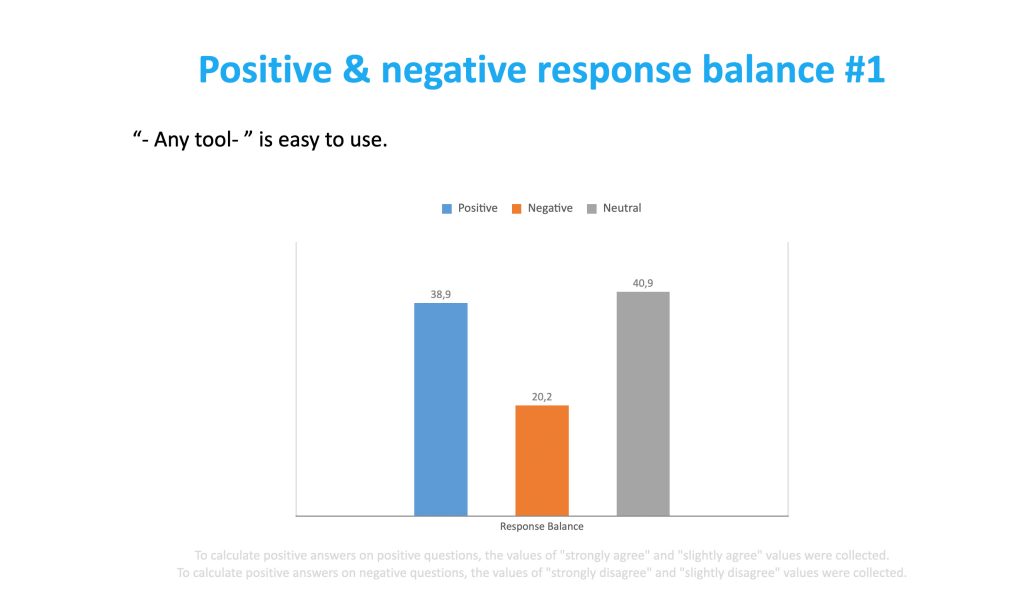
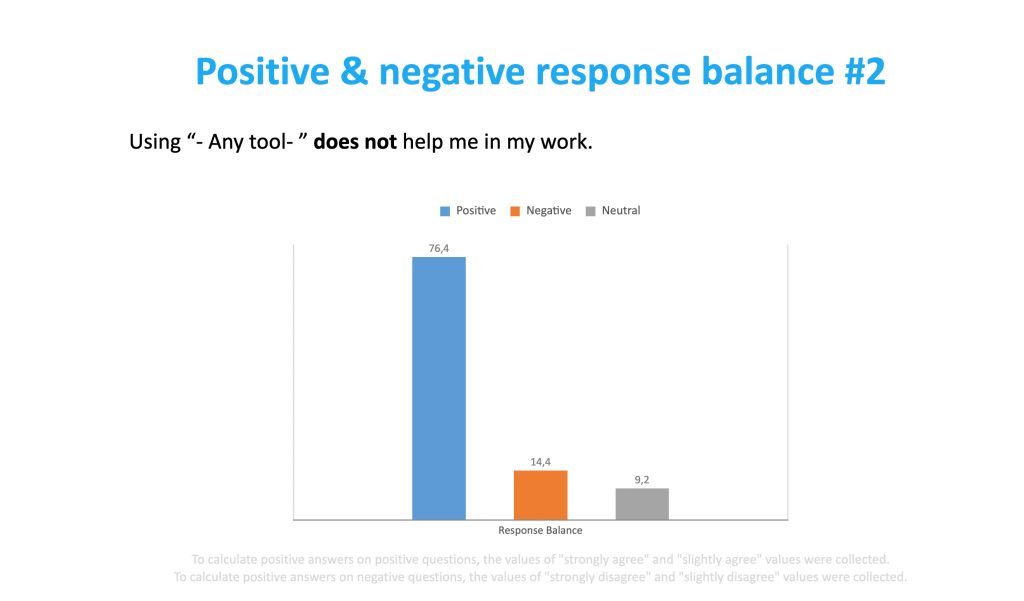
I grouped the answers into positive, negative, and neutral response balances. This made the results easier to read and helped the team quickly see where users were confident, where they were struggling, and where opinions were still undecided.
Neutral answers were especially important because they showed areas that could easily become negative if the experience was not improved.
Overall, the findings showed that users trusted the product’s value, but struggled with its usability and clarity.


Key Positive and Negative Findings
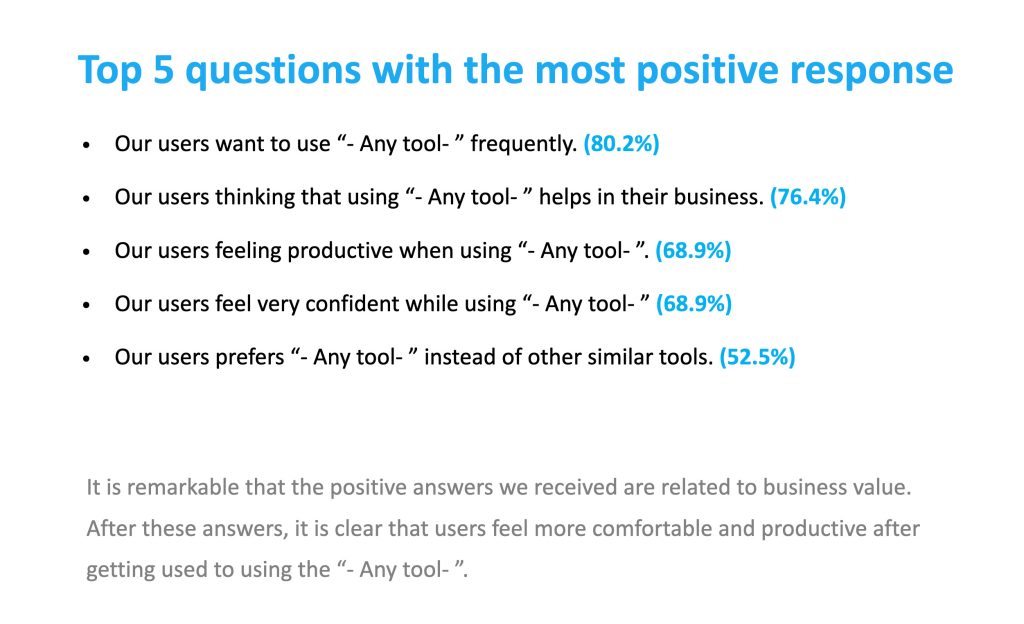
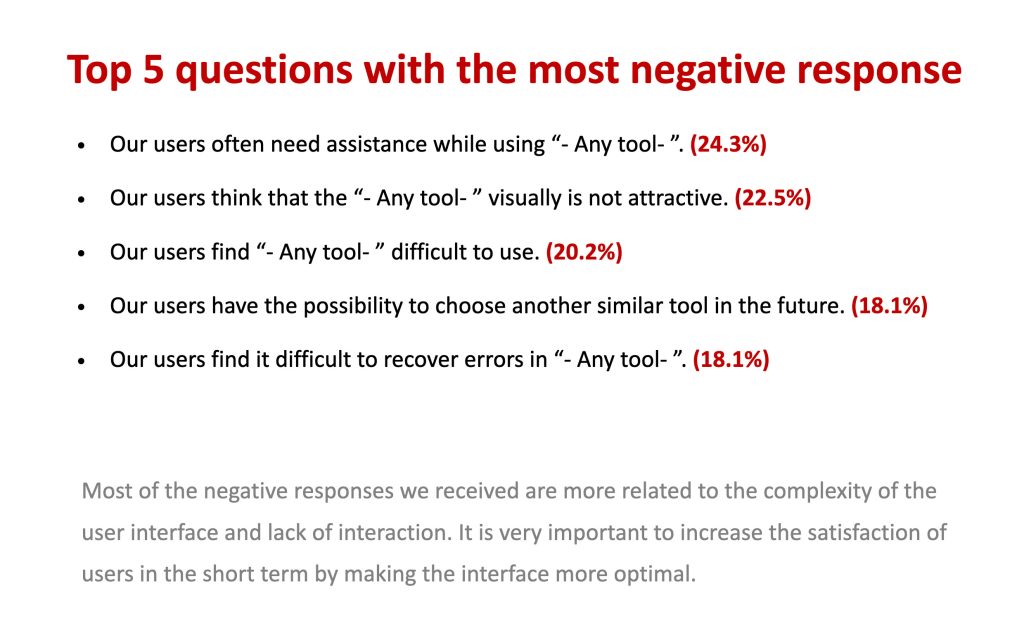
I listed the strongest positive and negative response patterns to make the findings easier to prioritize.
The positive answers showed that users saw business value in the tool and wanted to keep using it. The negative answers pointed to interface complexity, lack of visual clarity, difficulty recovering from errors, and a need for more support during use.


Recommendations and Product Actions
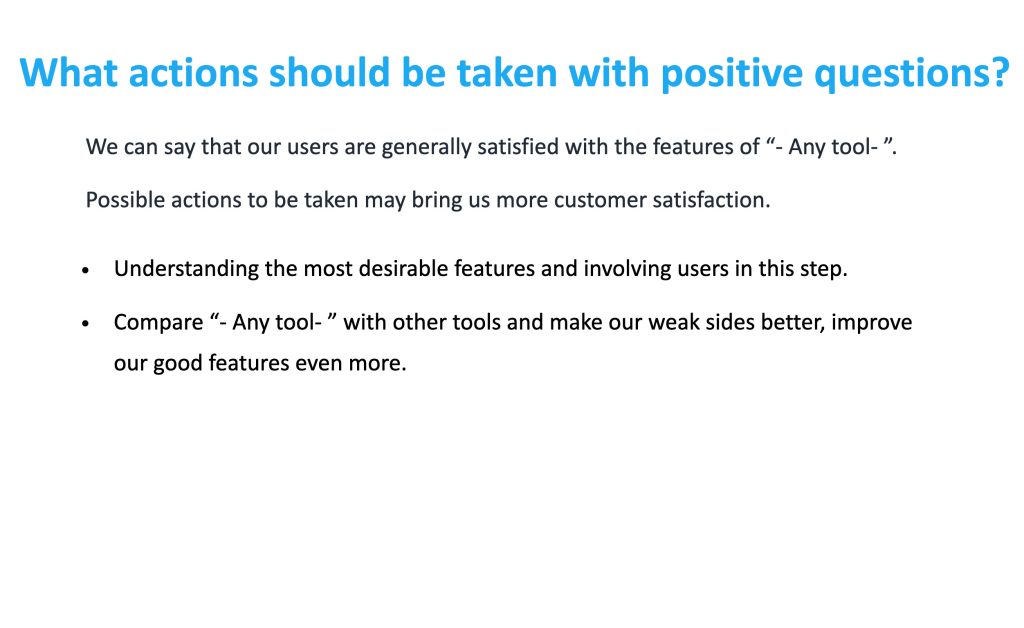
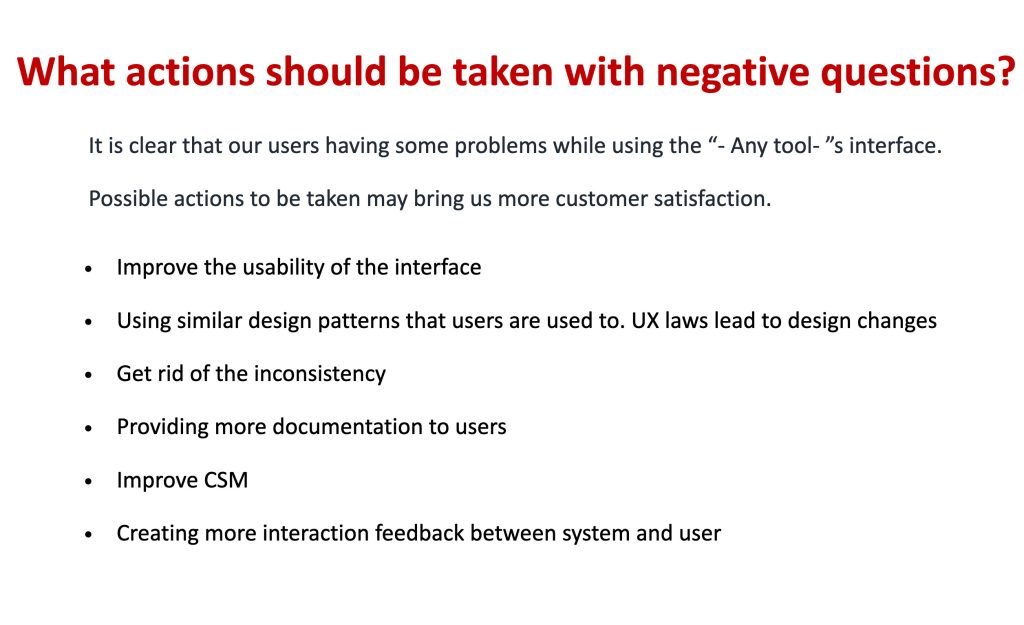
Based on the SUS results, I translated the findings into product and support actions. The main recommendation was not to rethink the value proposition of the tool, but to improve the usability layer around it.
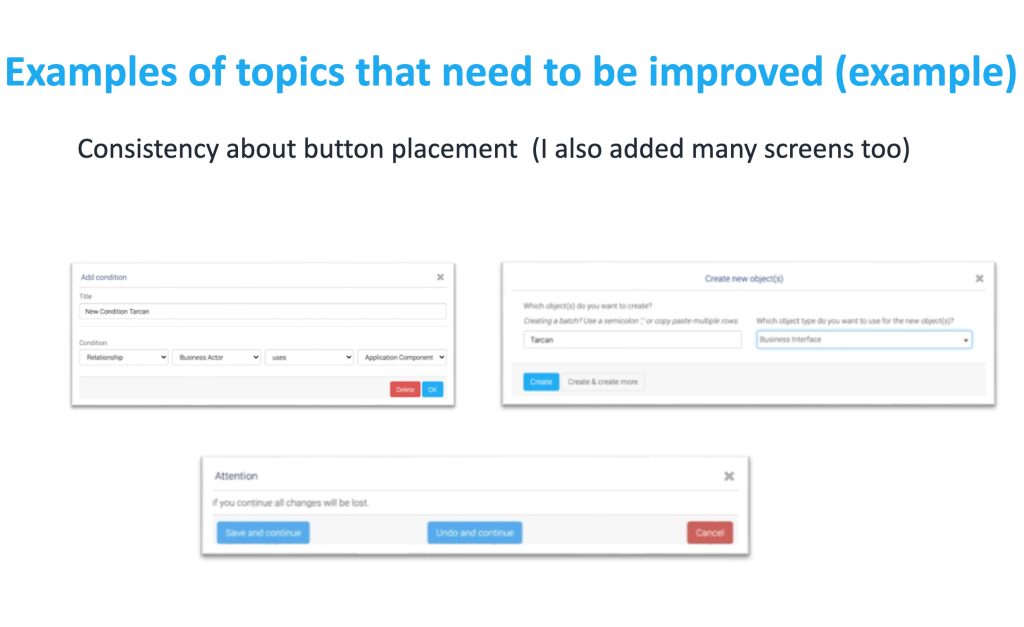
The product had clear value for users, but the interface made some workflows feel harder than they needed to be. I recommended improving consistency, interaction feedback, error recovery, documentation, and support touchpoints.


User Level Segmentation and Outcome
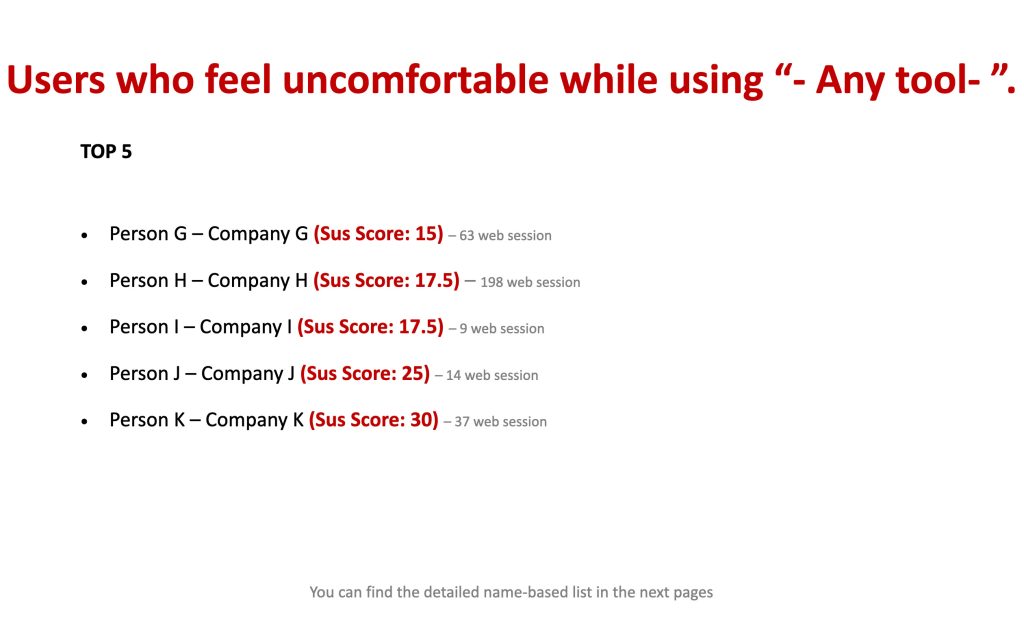
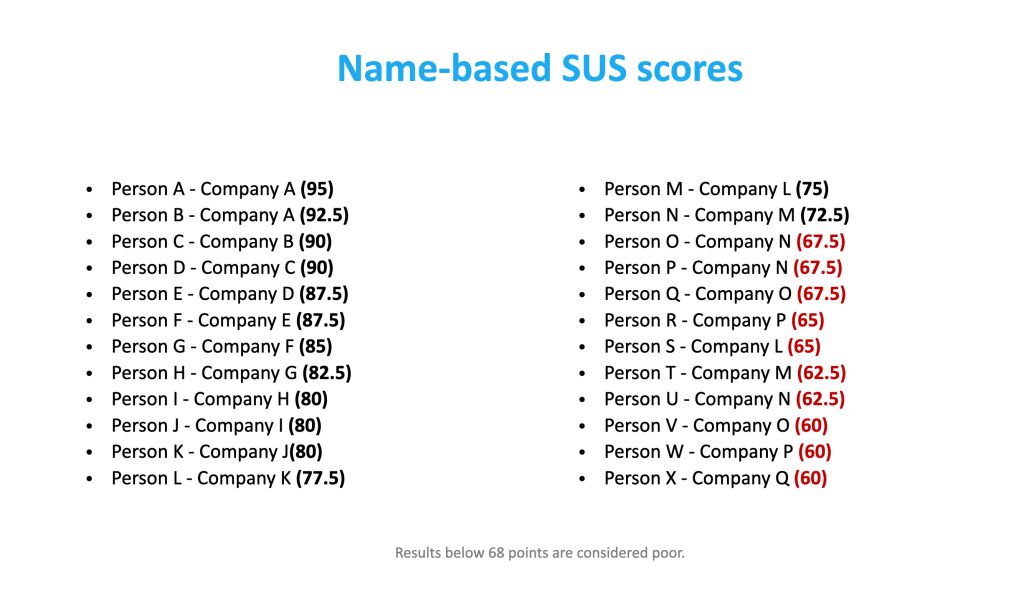
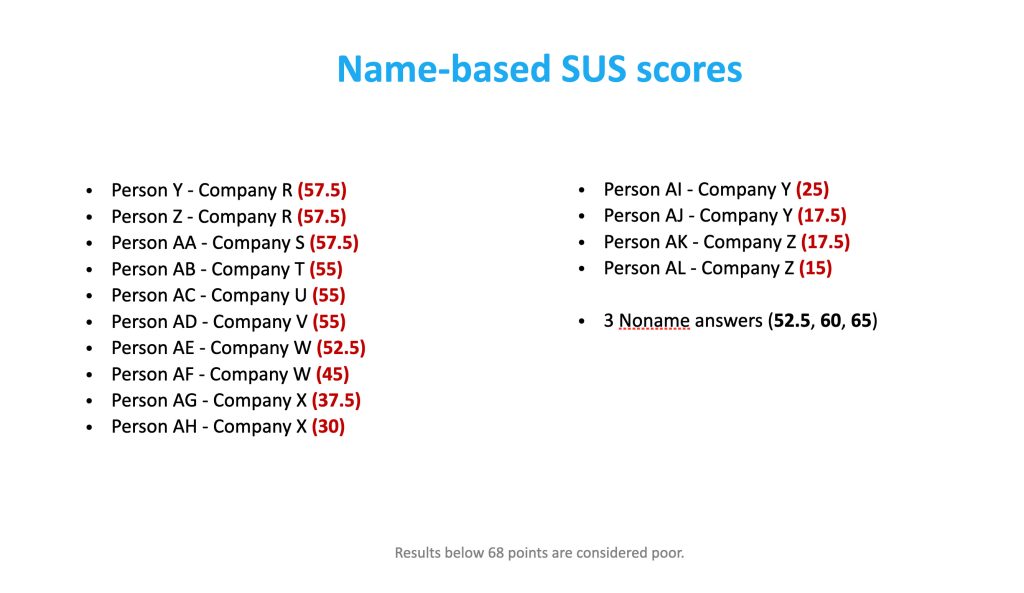
I also created a user-level SUS score list to identify the users who had the lowest satisfaction with the tool. This made the research directly actionable for the customer support team.
This made the research directly actionable, allowing the team to move from insights to real user support.
Instead of treating the SUS score only as a product metric, we used it as an early warning signal. Users with low scores were contacted, their problems were discussed, and some at-risk customers were recovered through follow-up support.
This project demonstrated how usability research can directly support both product decisions and customer retention.
This project showed how usability research can directly support both product decisions and customer retention.